Cryptocurrency analytics

Analysis that shows its working

A crypto analytics platform where every reading carries its reasoning. A deterministic engine computes the market structure, a language layer explains it in plain sentences, and the same figures are drawn onto the chart, so the picture and the paragraph cannot disagree.

Crypto analyticsNext.js 16SupabaseAI agents

Live at usetranceai.com

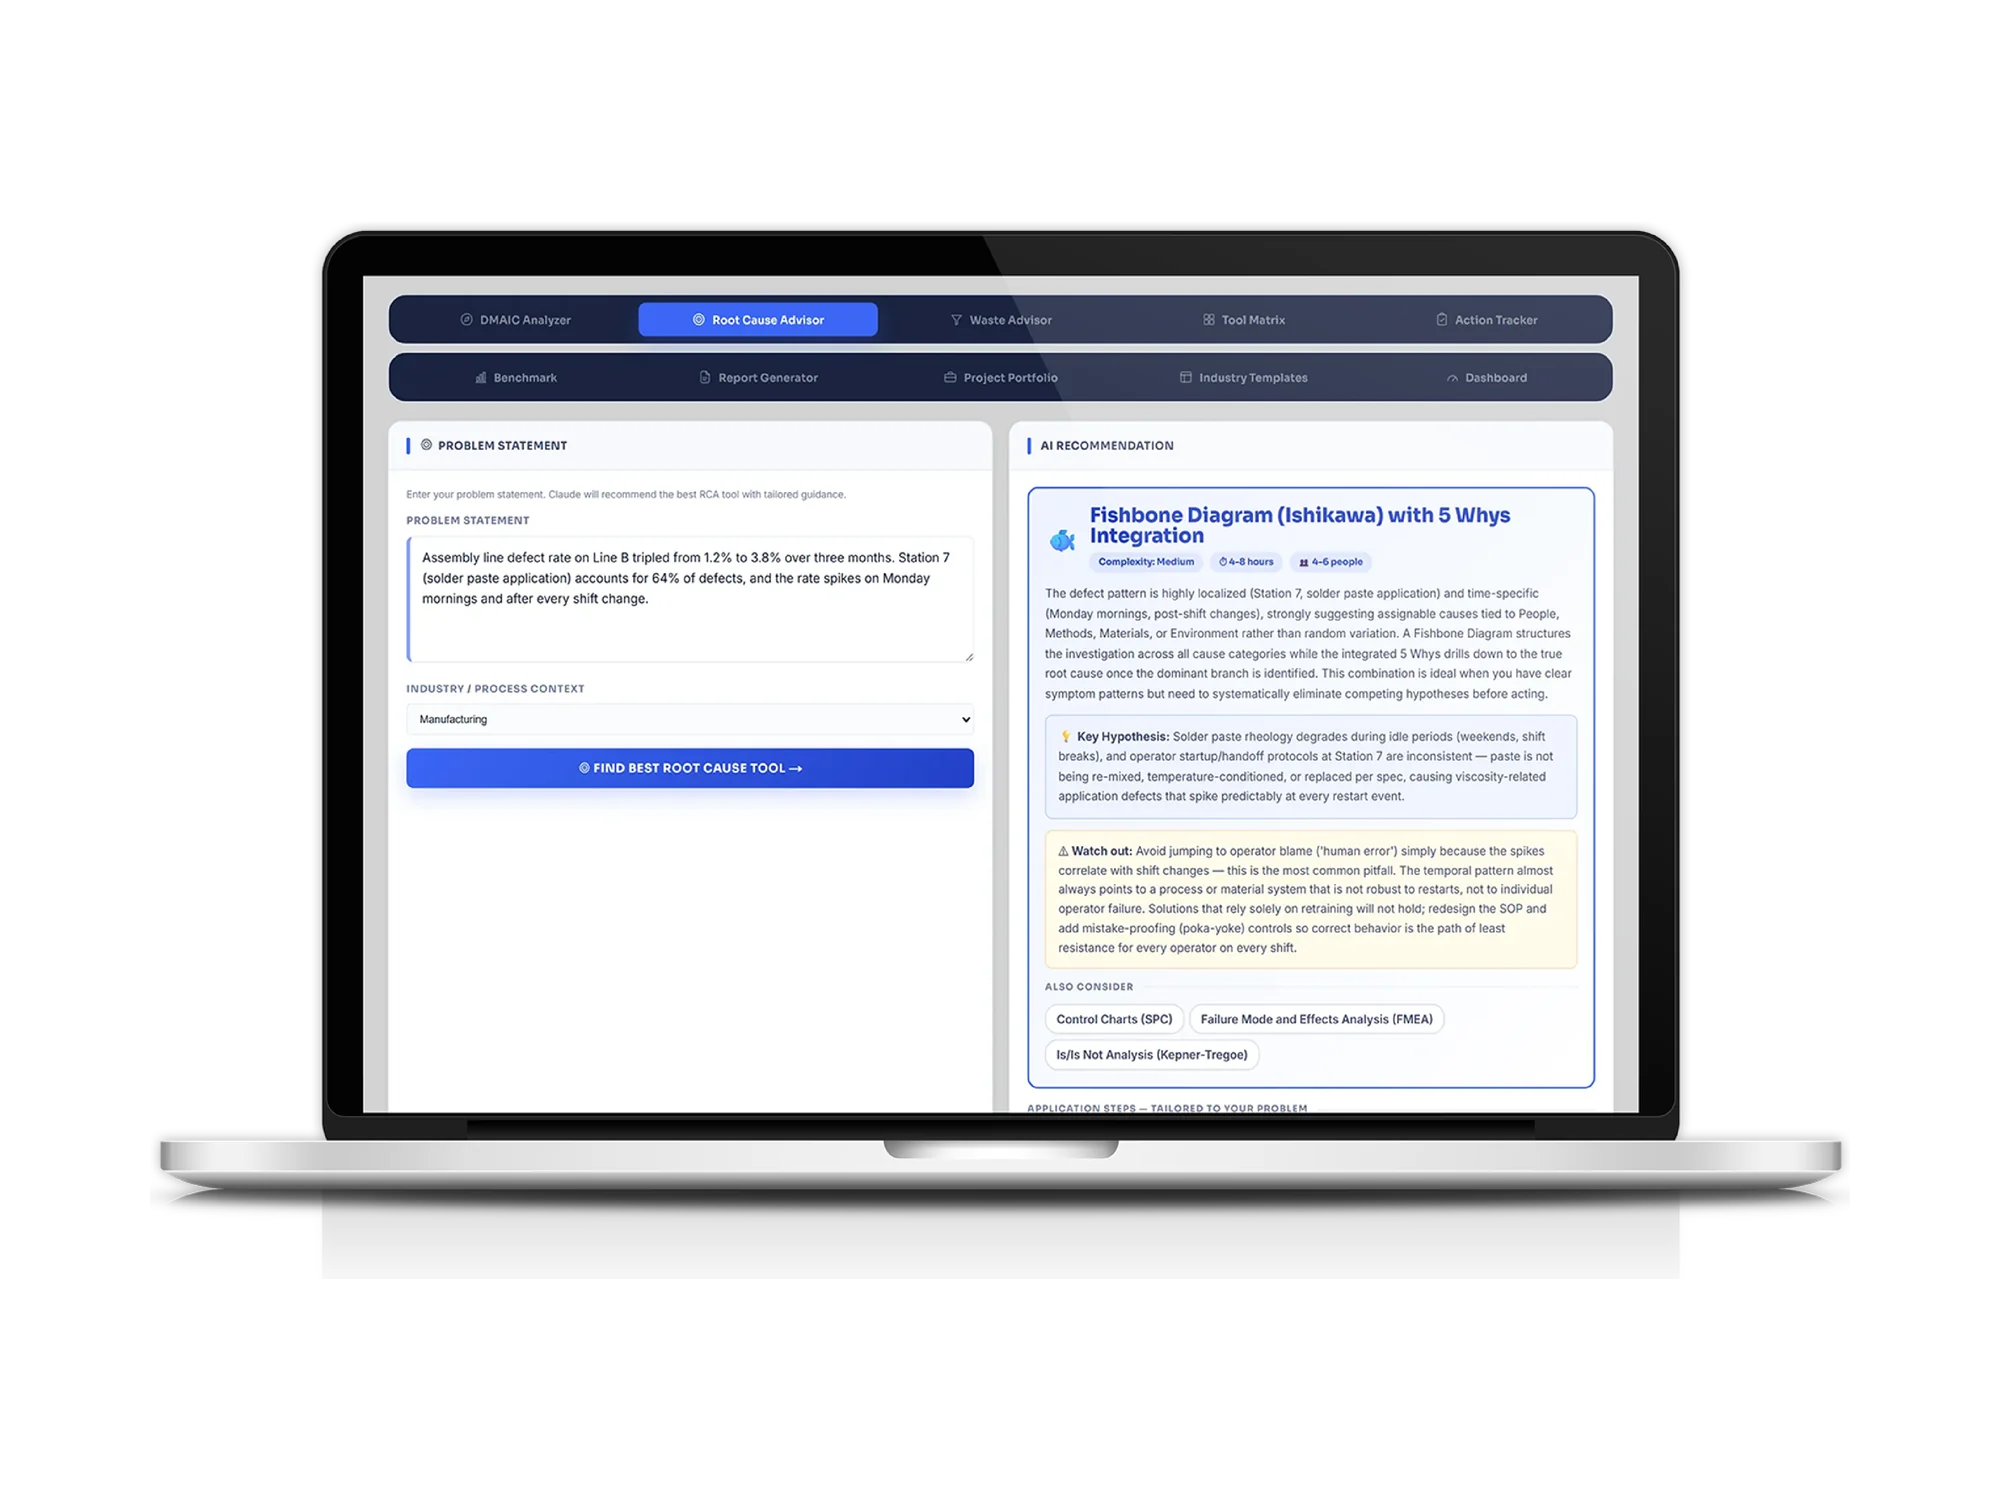
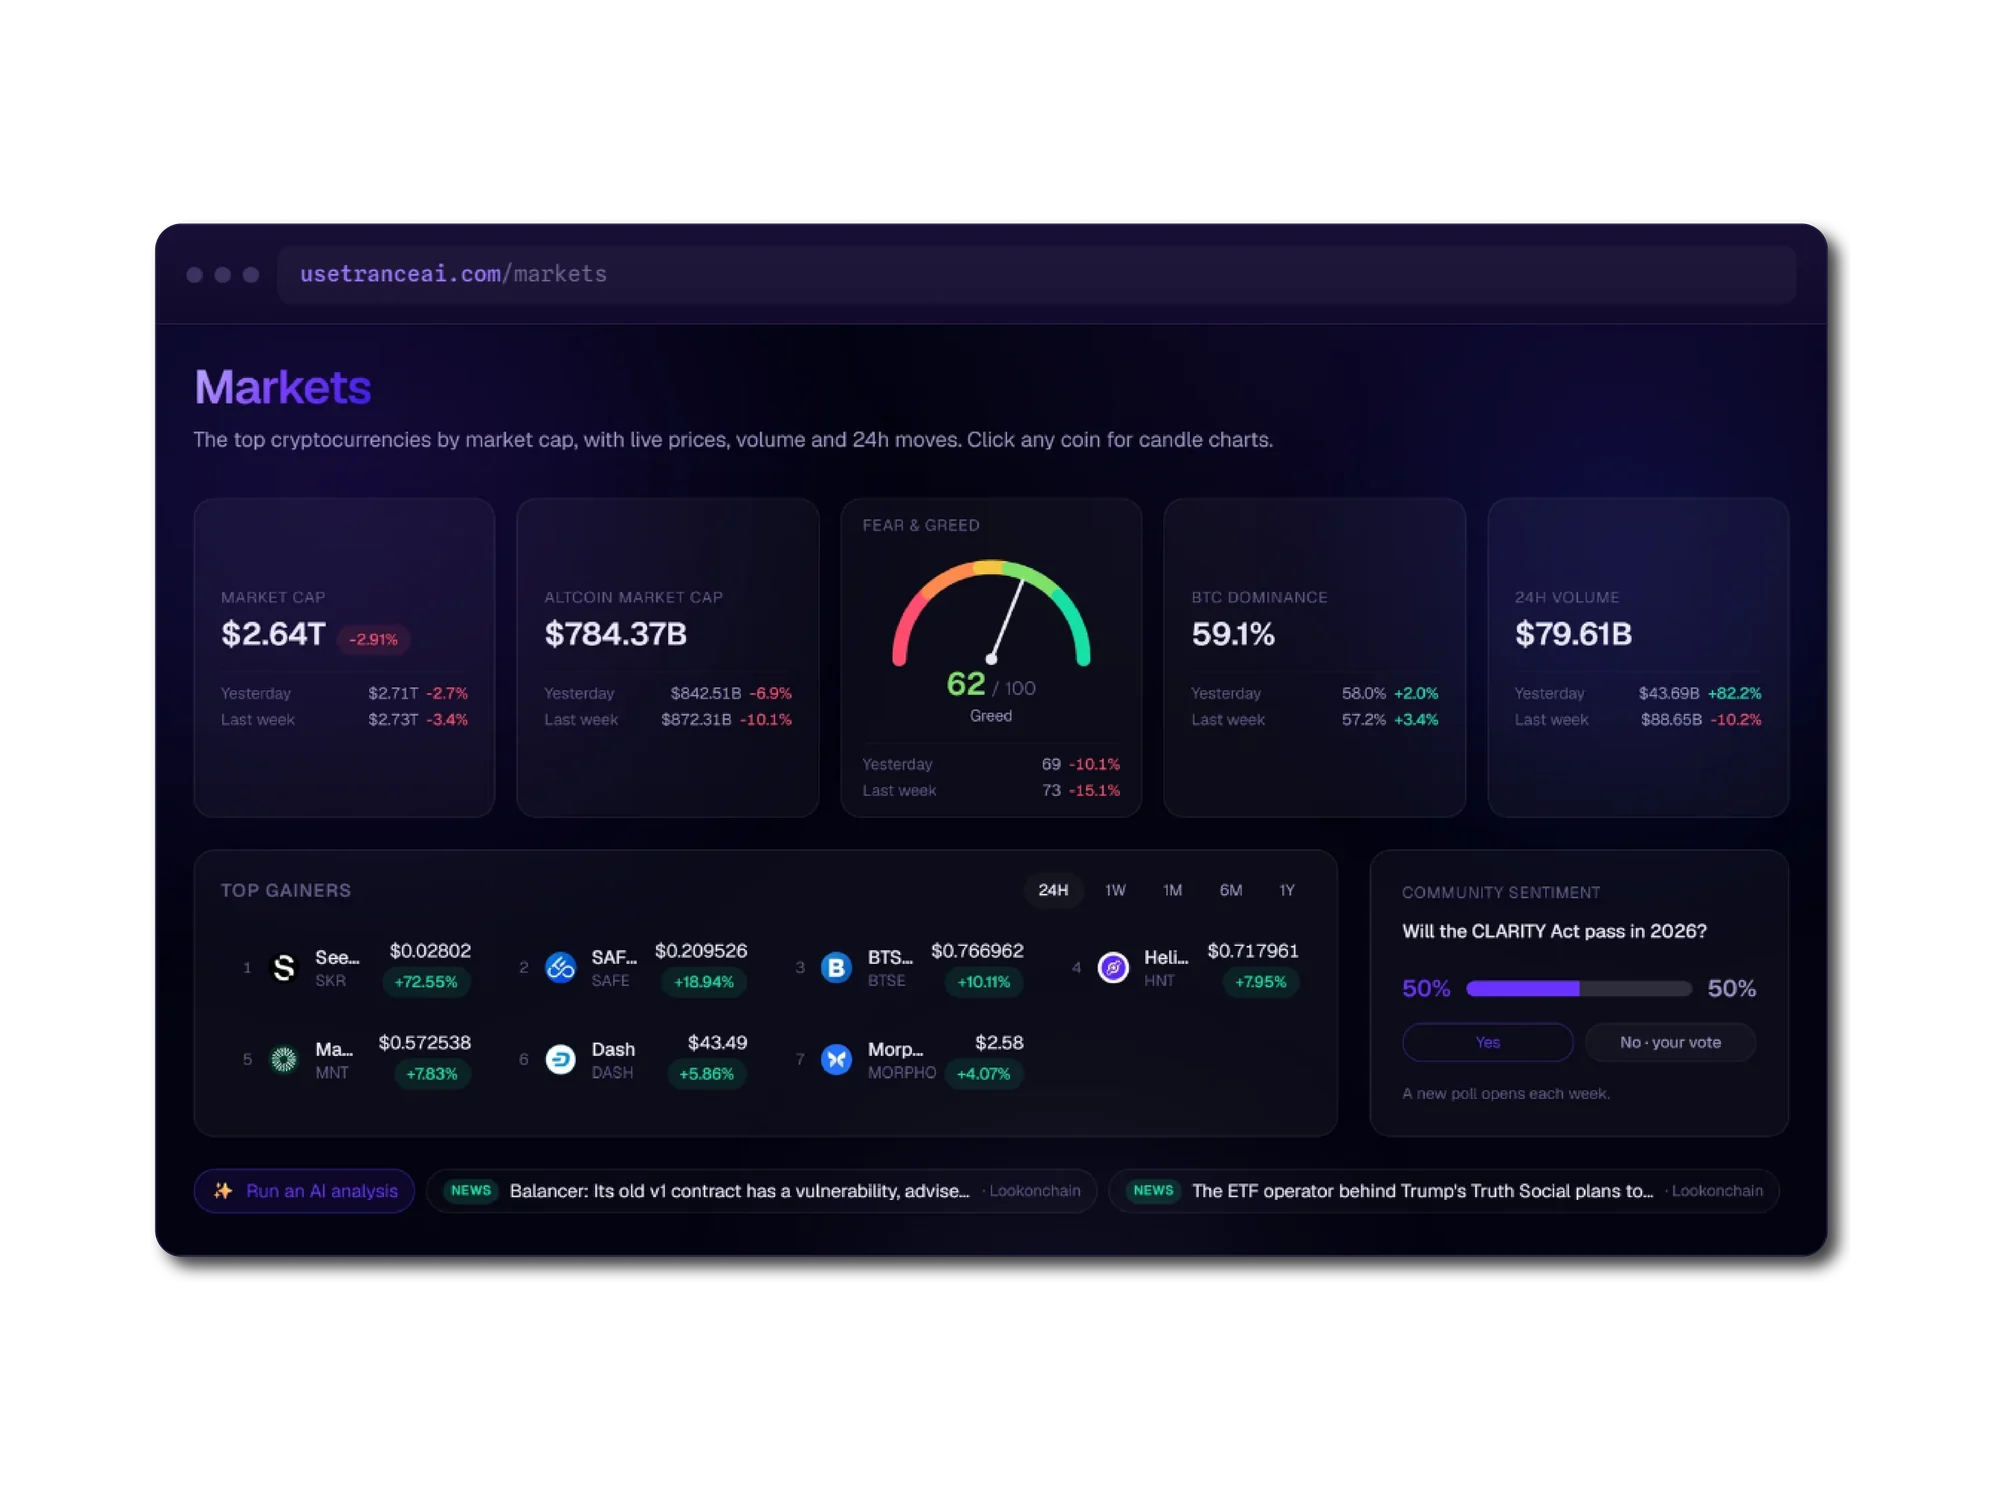
TranceAI shown across a laptop and two browser windows
About the product

Market analysis that shows its working

Most crypto tools give you a signal and leave you to trust it. A number appears, an arrow points somewhere, and nothing tells you how it was reached or what it would take to be wrong. For a trader putting real money down, that gap is the whole problem, because an unexplained call is indistinguishable from a guess.

TranceAI closes that gap. A deterministic analysis engine of fifteen modules computes market structure, support and resistance, trendlines, fibonacci levels, channels and a risk-managed scenario from raw candles. A language model is then handed only what the engine already computed and asked to write it up in plain sentences, so it never invents a number of its own. The same figures are drawn onto the chart, and a test rejects any chart label carrying a figure the engine did not produce.

Around that core sits the rest of a working product: live market data and a sortable hundred-coin table, a DEX screener watching new liquidity pools across chains, view-only wallet tracking on Ethereum and Solana, subscription billing through Stripe, and a weekly community poll, across twenty-seven API route handlers.

Industry
Cryptocurrency analytics and fintech
Platform
Responsive web application
Timeline
About twelve weeks, June to August 2026
Team
One developer

What we did

  • Frontend development
  • Backend development
  • Database design
  • Third-party integrations
  • Subscription billing
  • UI implementation

Stack

Next.js 16React 19TypeScriptTailwind CSS v4SupabaseStripeLightweight ChartsviemSolana web3.js
Goals

What the build had to achieve

Explain, do not assert

Every reading has to carry its reasoning. The engine produces the numbers and the language layer is only allowed to describe what it was handed, so a user can always trace a verdict back to the indicators that produced it.

The chart cannot lie

The written analysis and the drawing on the chart come from one set of numbers. That is enforced mechanically rather than by convention: a test rejects any chart label containing a figure the engine did not compute.

A reading is not an instruction

Being bullish and being a buy are different claims. The engine keeps the verdict and the trade instruction separate, and will decline to propose a trade even while reporting a bullish structure.

Bounded, predictable cost

An AI feature with an unbounded bill is not shippable. Spend is capped at two levels and degrades gracefully rather than failing, so unit economics stay predictable as usage grows.

Inside the product

TranceAI, screen by screen

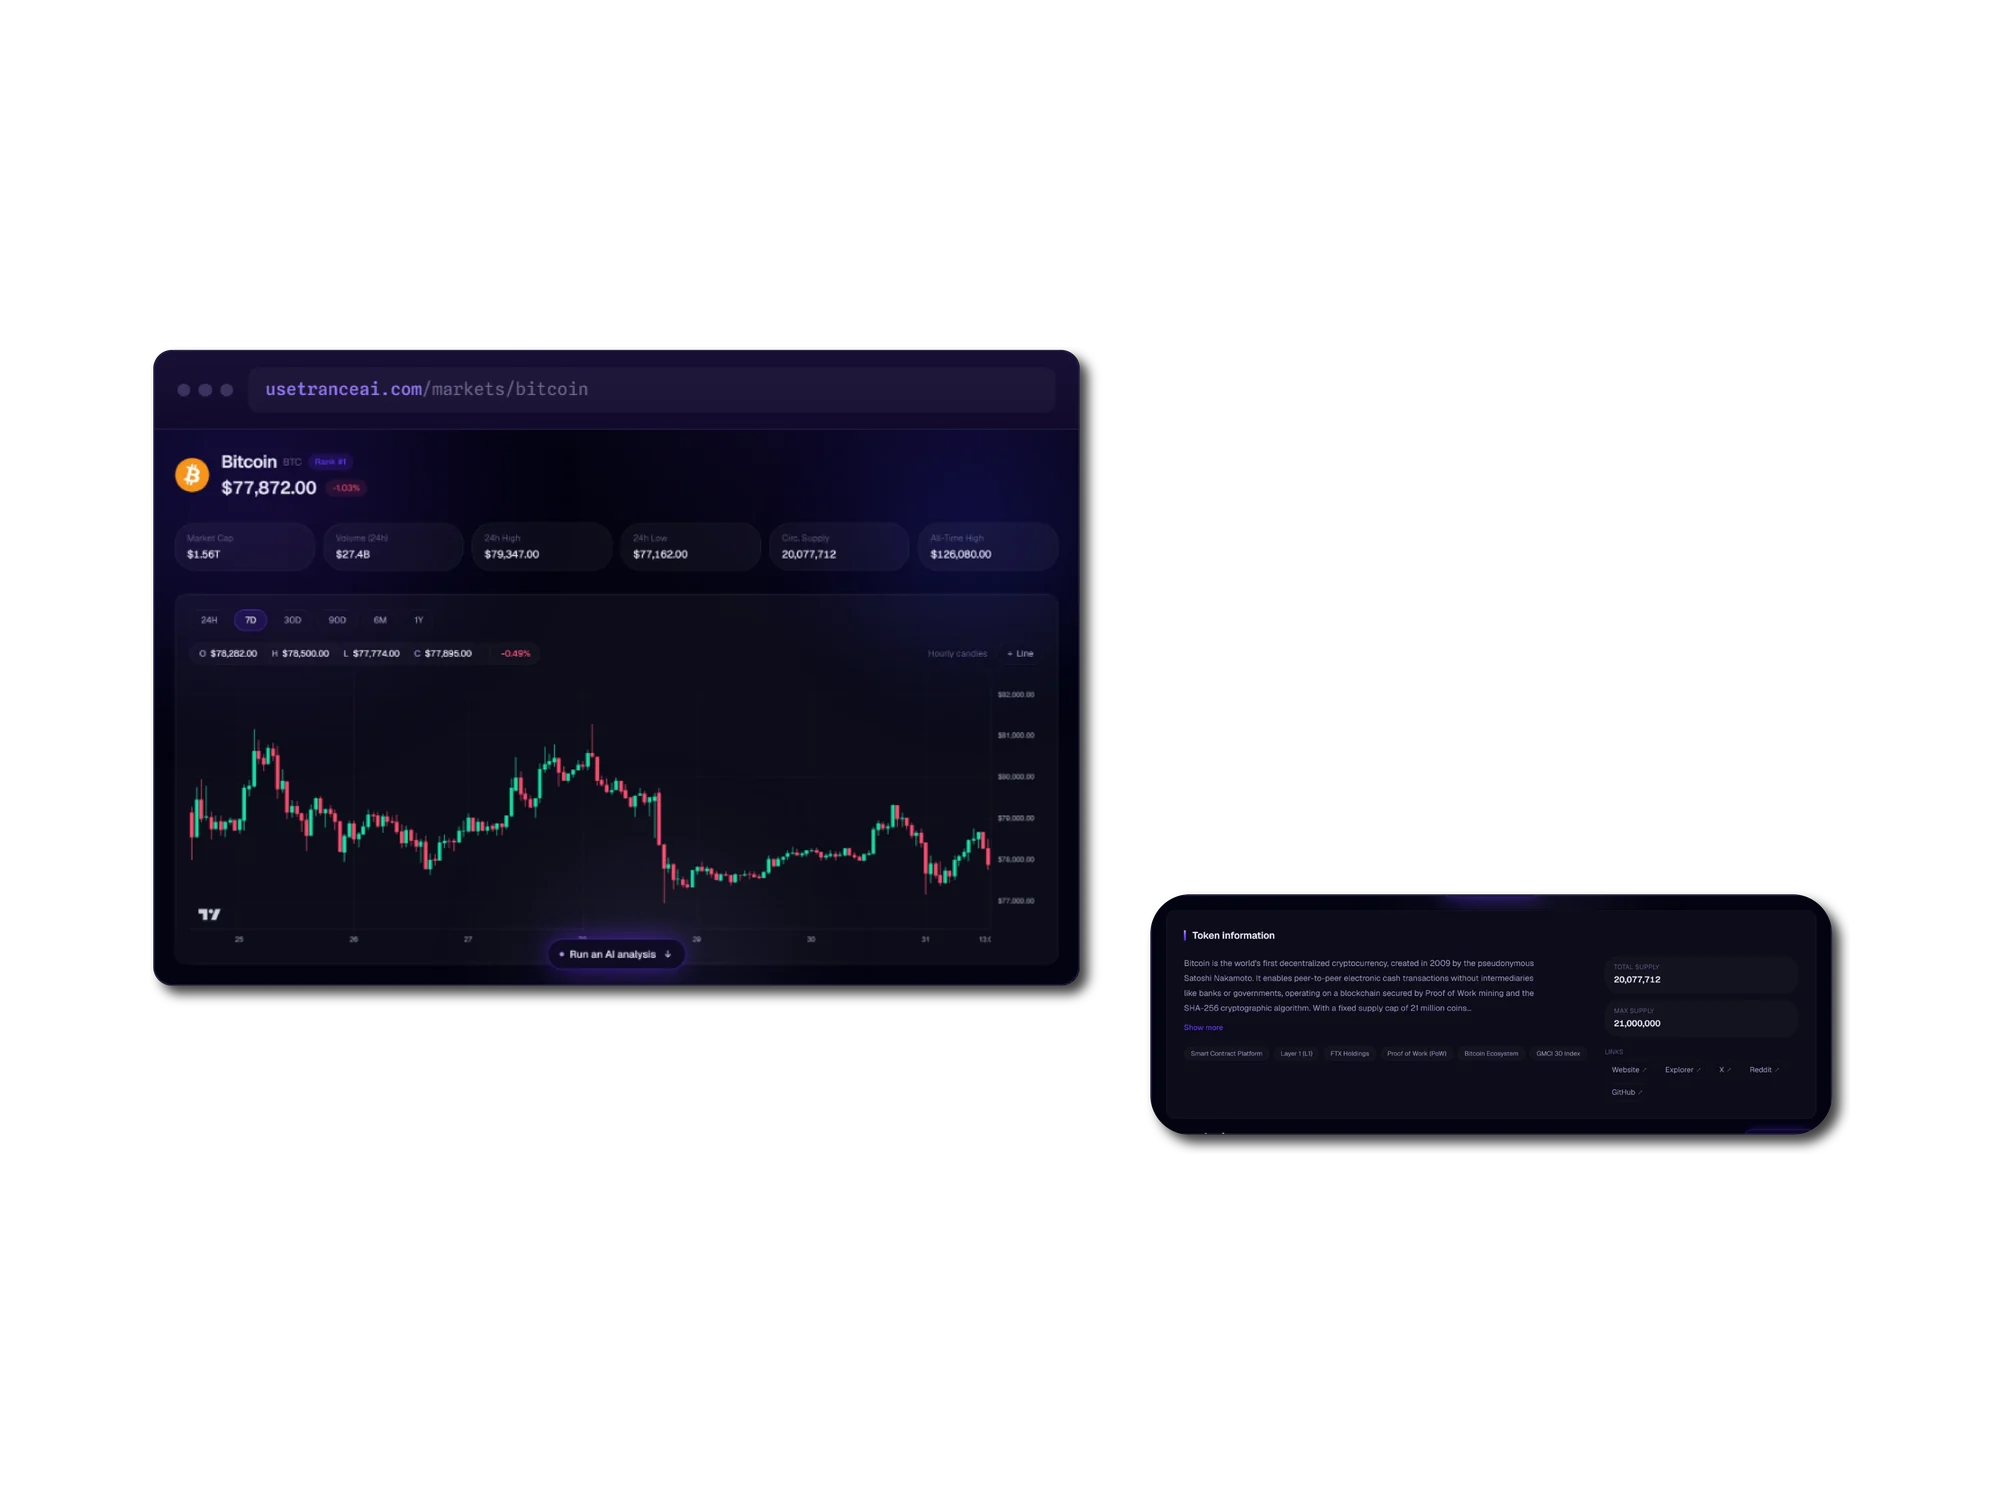
A browser window showing the Bitcoin page at 77,872 dollars, ranked number one, with summary tiles for market cap, 24-hour volume, high, low, circulating supply and all-time high above a seven-day hourly candle chart. A second panel beside it shows a Token information card describing Bitcoin, with total and maximum supply figures and links to the website, explorer, X, Reddit and GitHub.
01

Coin detail and candles

Every coin opens onto its own candle chart, with market cap, volume, the 24-hour range, circulating supply and all-time high above it, and a Run an AI analysis button waiting underneath.

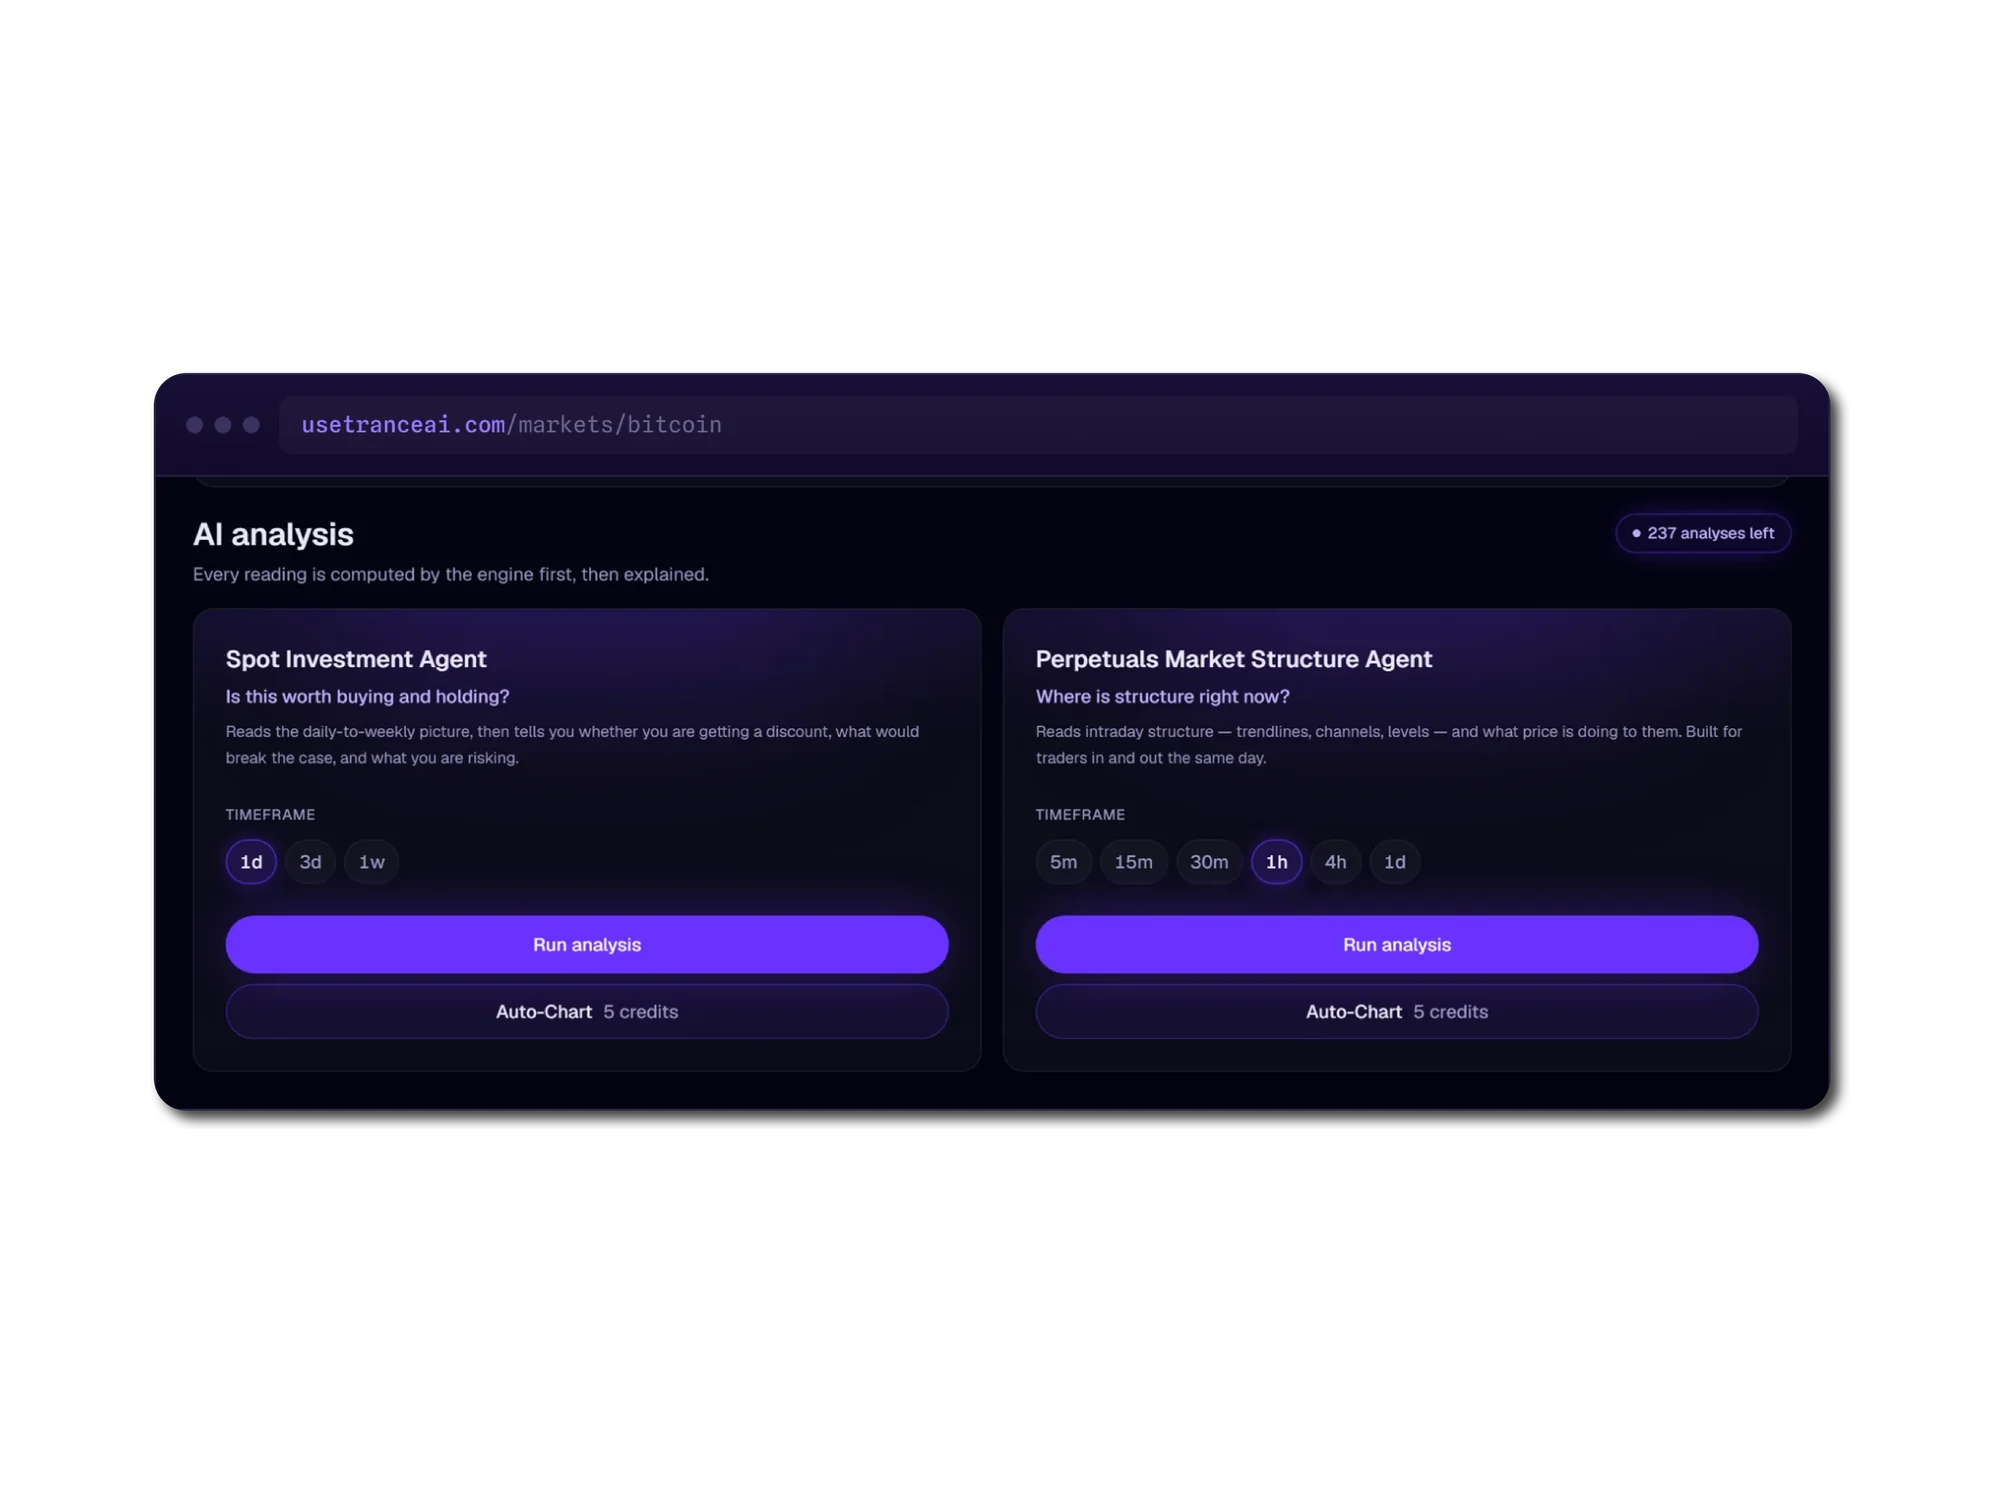
A browser window headed AI analysis, noting that every reading is computed by the engine first and then explained, with a counter reading 237 analyses left. Two cards sit side by side: Spot Investment Agent, asking is this worth buying and holding, offering one-day, three-day and one-week timeframes; and Perpetuals Market Structure Agent, asking where structure is right now, offering five-minute through one-day timeframes. Each card carries a Run analysis button and an Auto-Chart option costing five credits.
02

Two agents, one market

A spot agent answers whether something is worth holding; a perpetuals agent reads intraday structure. Each carries its own timeframe set and its own rules about what it will and will not claim.

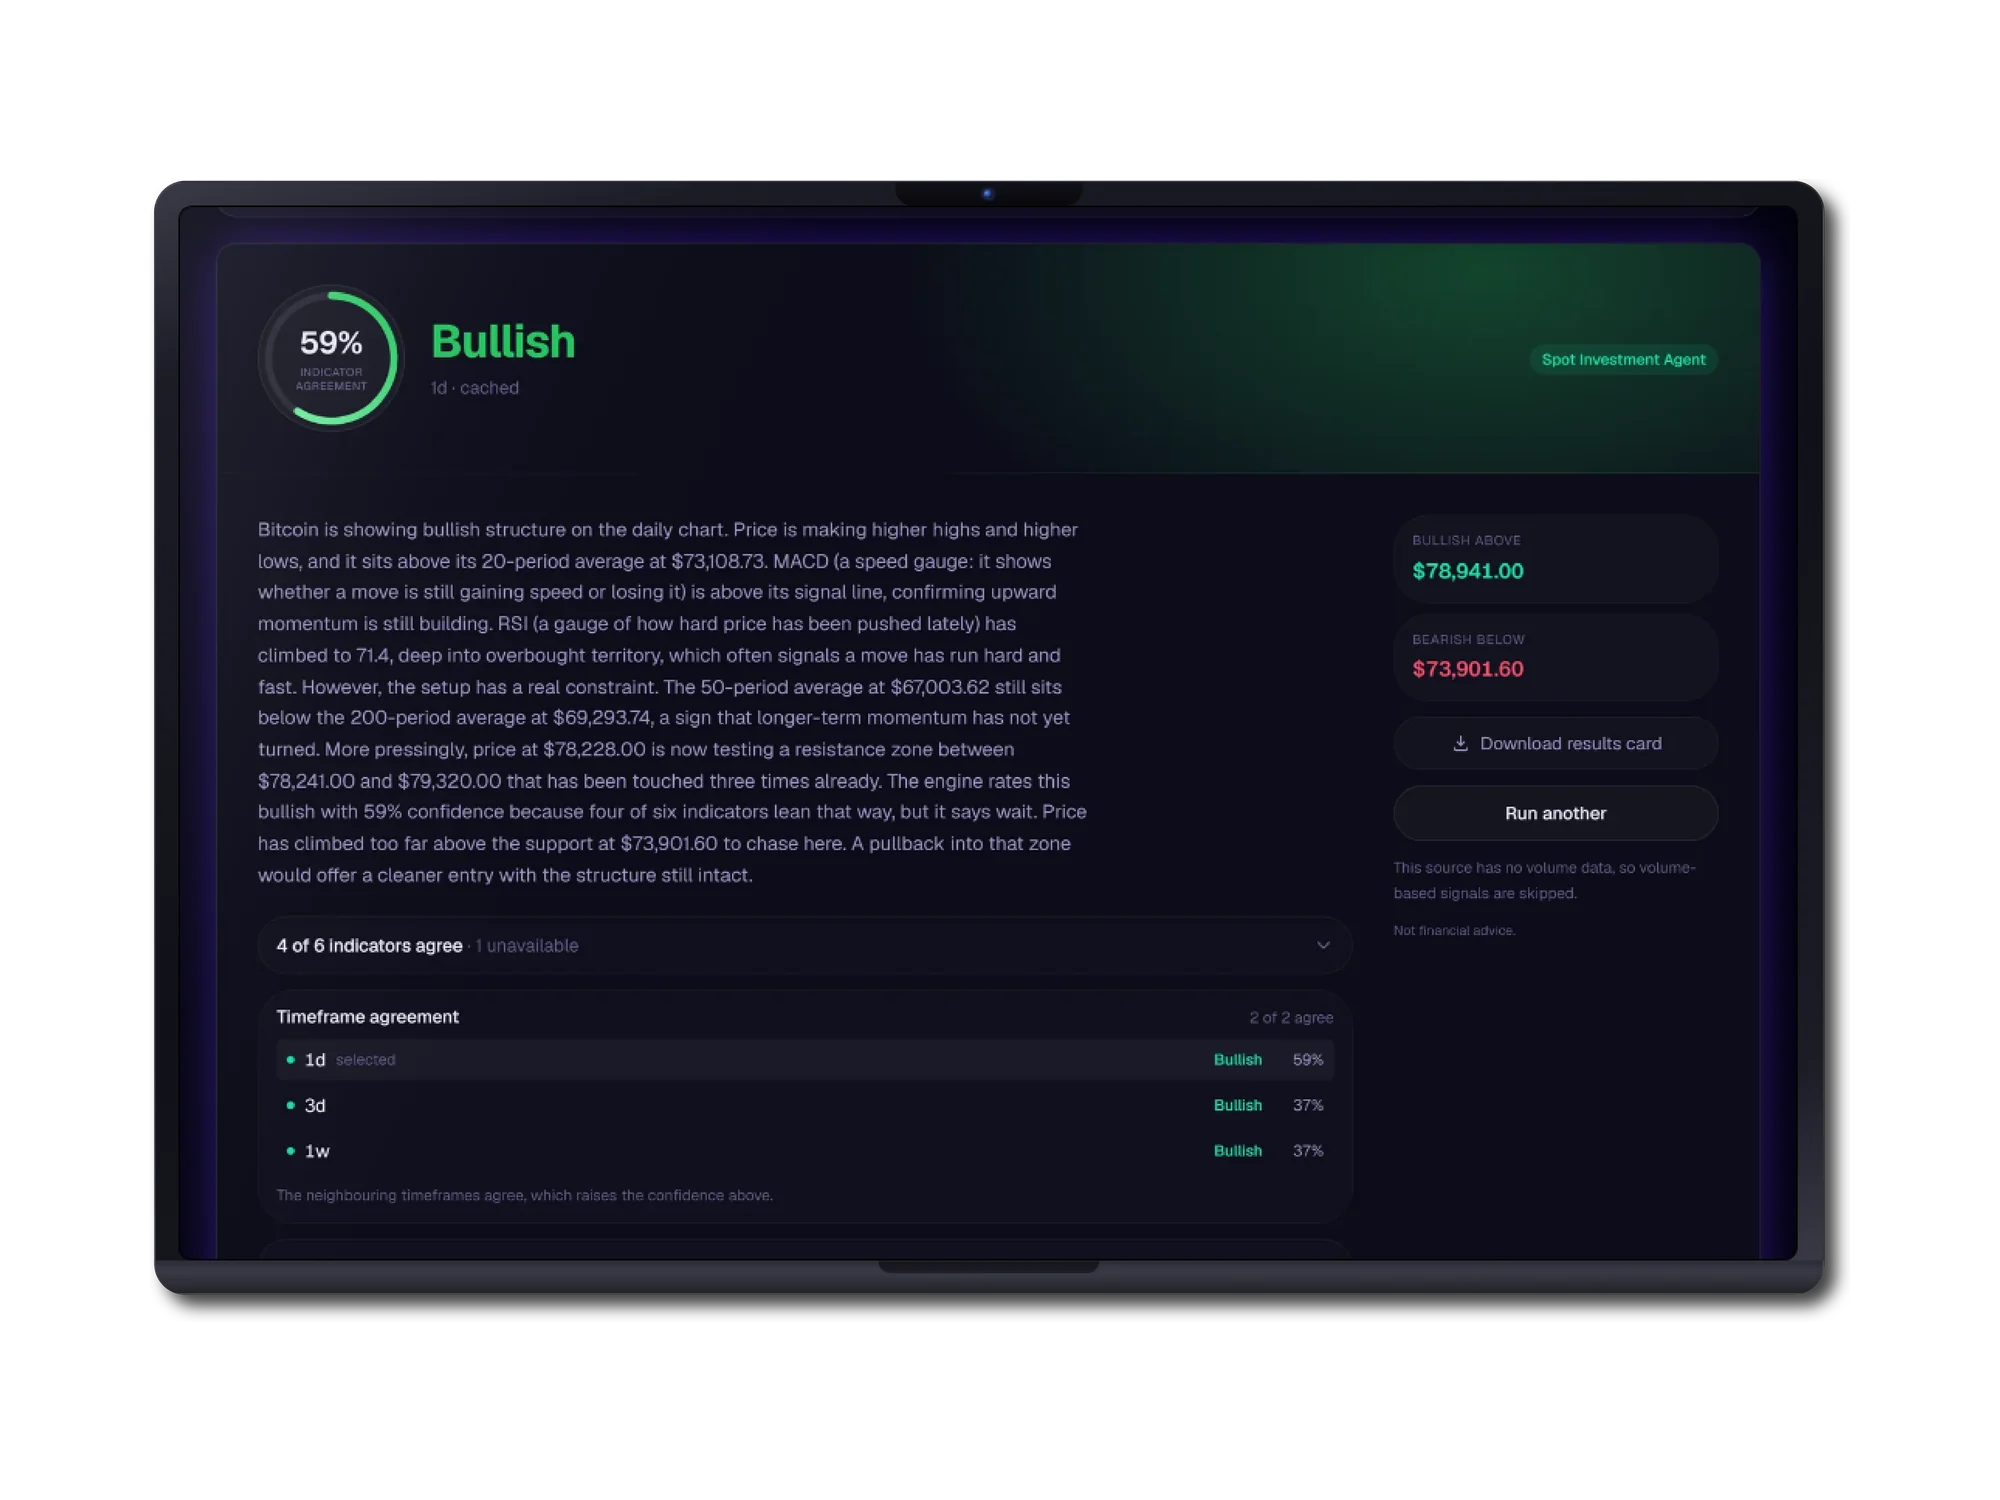
A tablet showing an analysis result headed Bullish at 59 percent indicator agreement, from the Spot Investment Agent. A long paragraph explains the daily structure, naming the twenty-period average, MACD, an RSI of 71.4 and a resistance zone touched three times, then concludes that the engine says wait because price has climbed too far above support. A side panel gives bullish above 78,941 dollars and bearish below 73,901.60 dollars, with buttons to download a results card or run another. Below, a row reads four of six indicators agree with one unavailable, over a timeframe agreement table listing one day, three day and one week as all bullish.
03

The reading, and why

The verdict arrives with its reasoning attached: which indicators agreed, what would break the case, and where the engine declines to act. Here it reads bullish and still says wait, because price has run too far above support to chase.

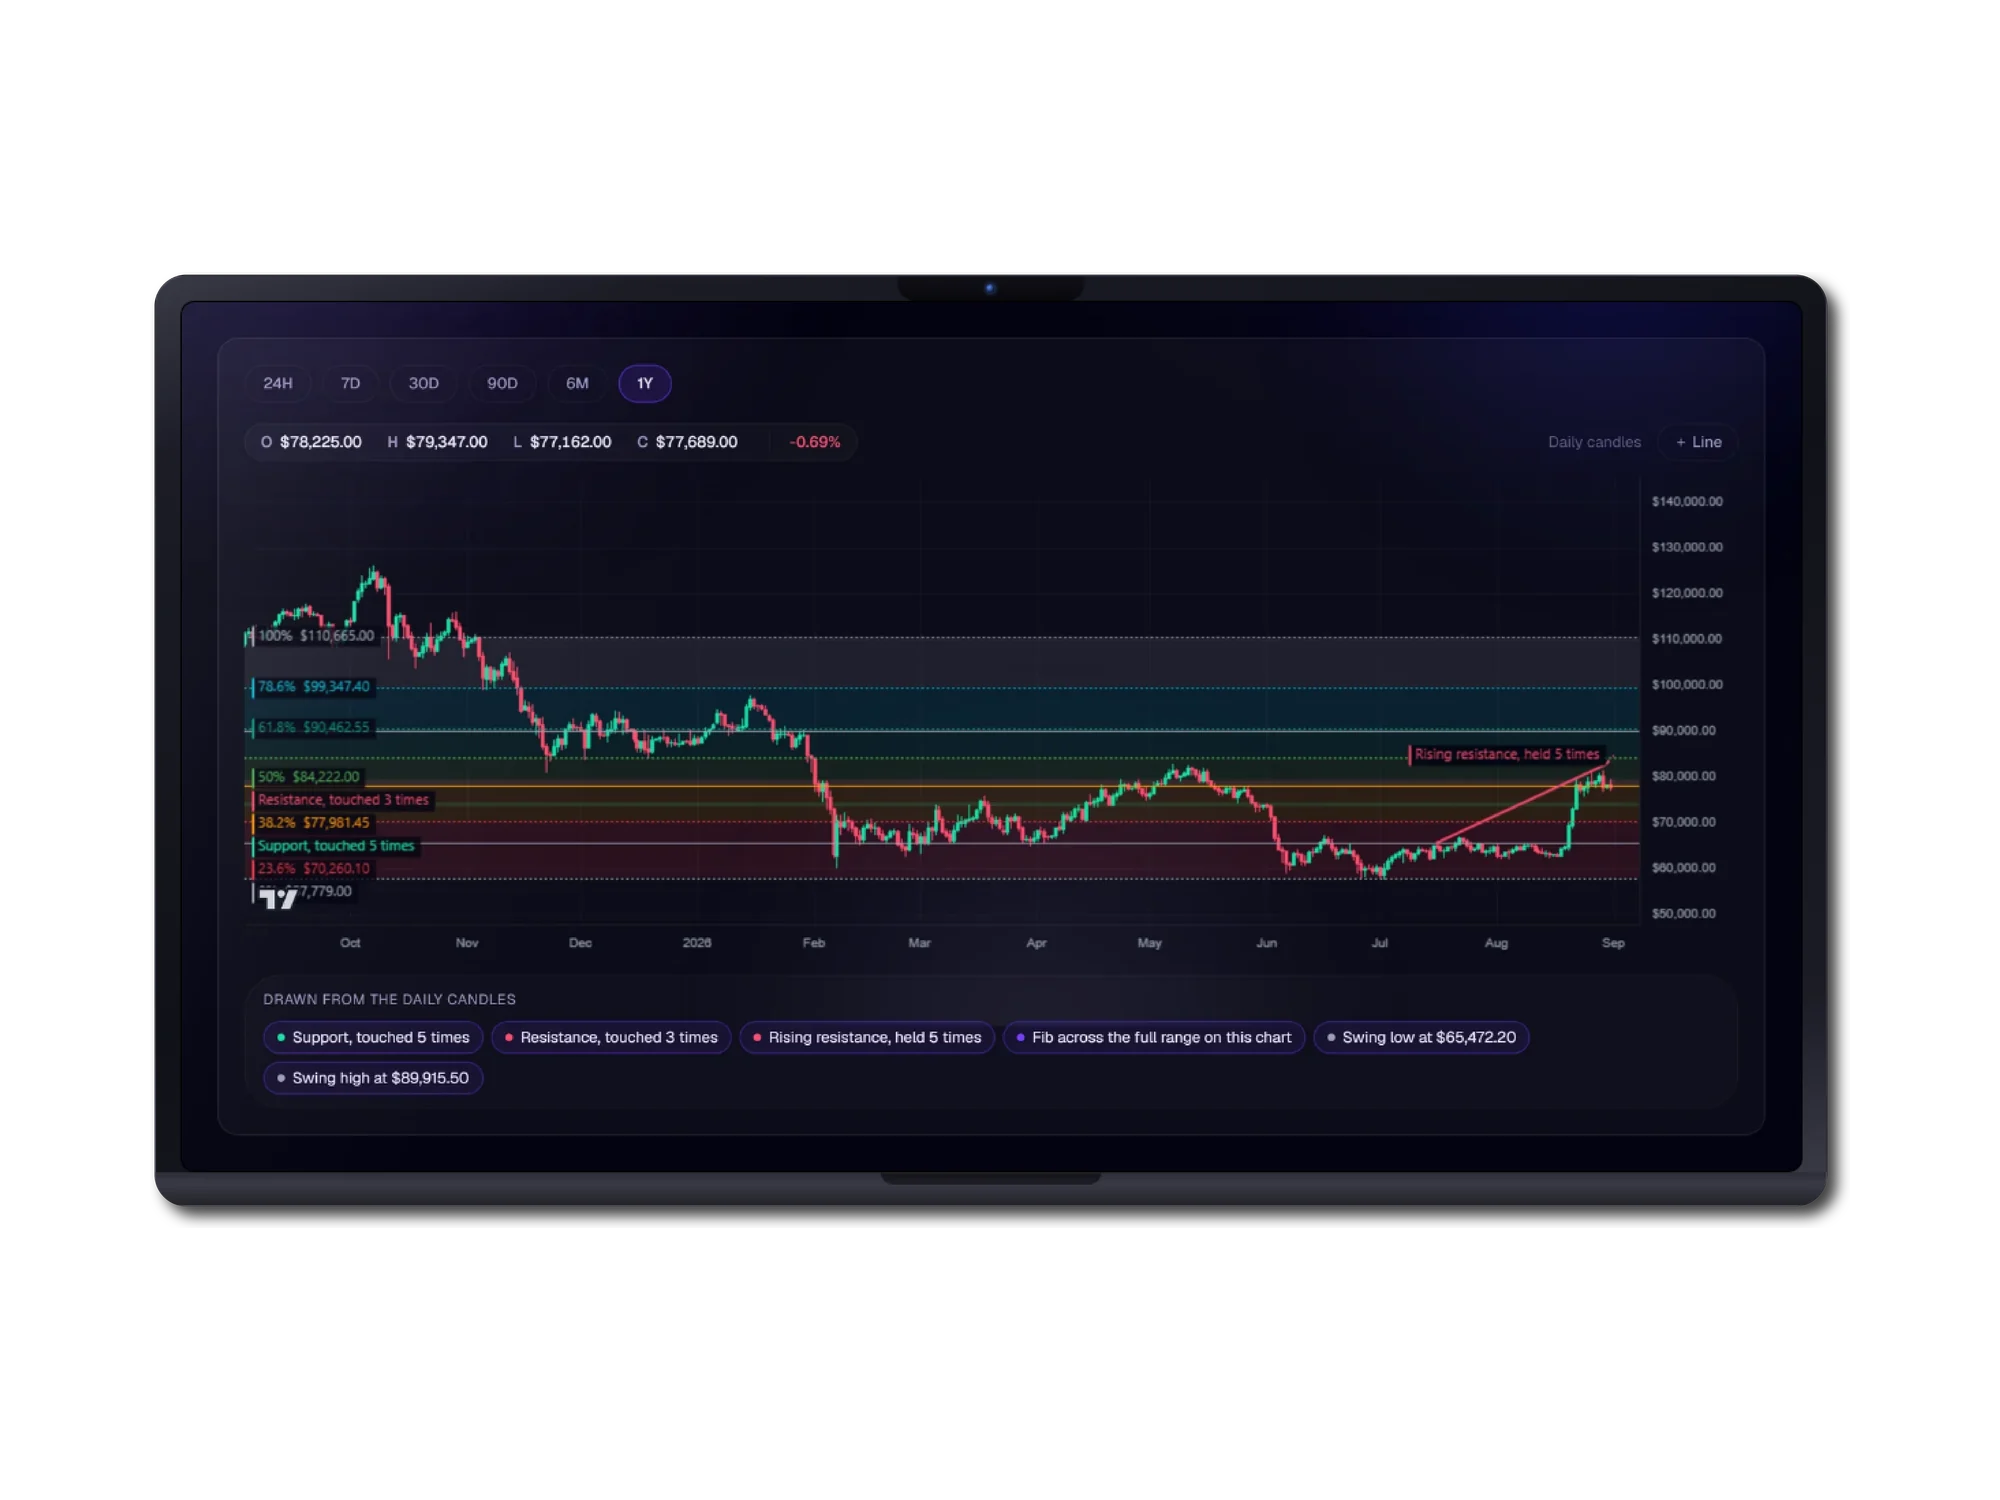
A tablet showing a one-year daily Bitcoin candle chart with the engine's analysis drawn over it: six labelled fibonacci levels from 23.6 percent at 70,260.10 dollars up to 100 percent at 110,665 dollars, a support line marked touched five times, a resistance line marked touched three times, and a rising resistance trendline marked held five times. A legend beneath is headed Drawn from the daily candles and repeats each element as a chip, including a swing low at 65,472.20 dollars and a swing high at 89,915.50 dollars.
04

Auto-Chart

The engine draws its own reading onto the candles: support and resistance as zones with touch counts, a labelled fibonacci set, and trendlines projected forward. A test rejects any label carrying a figure the engine did not compute.

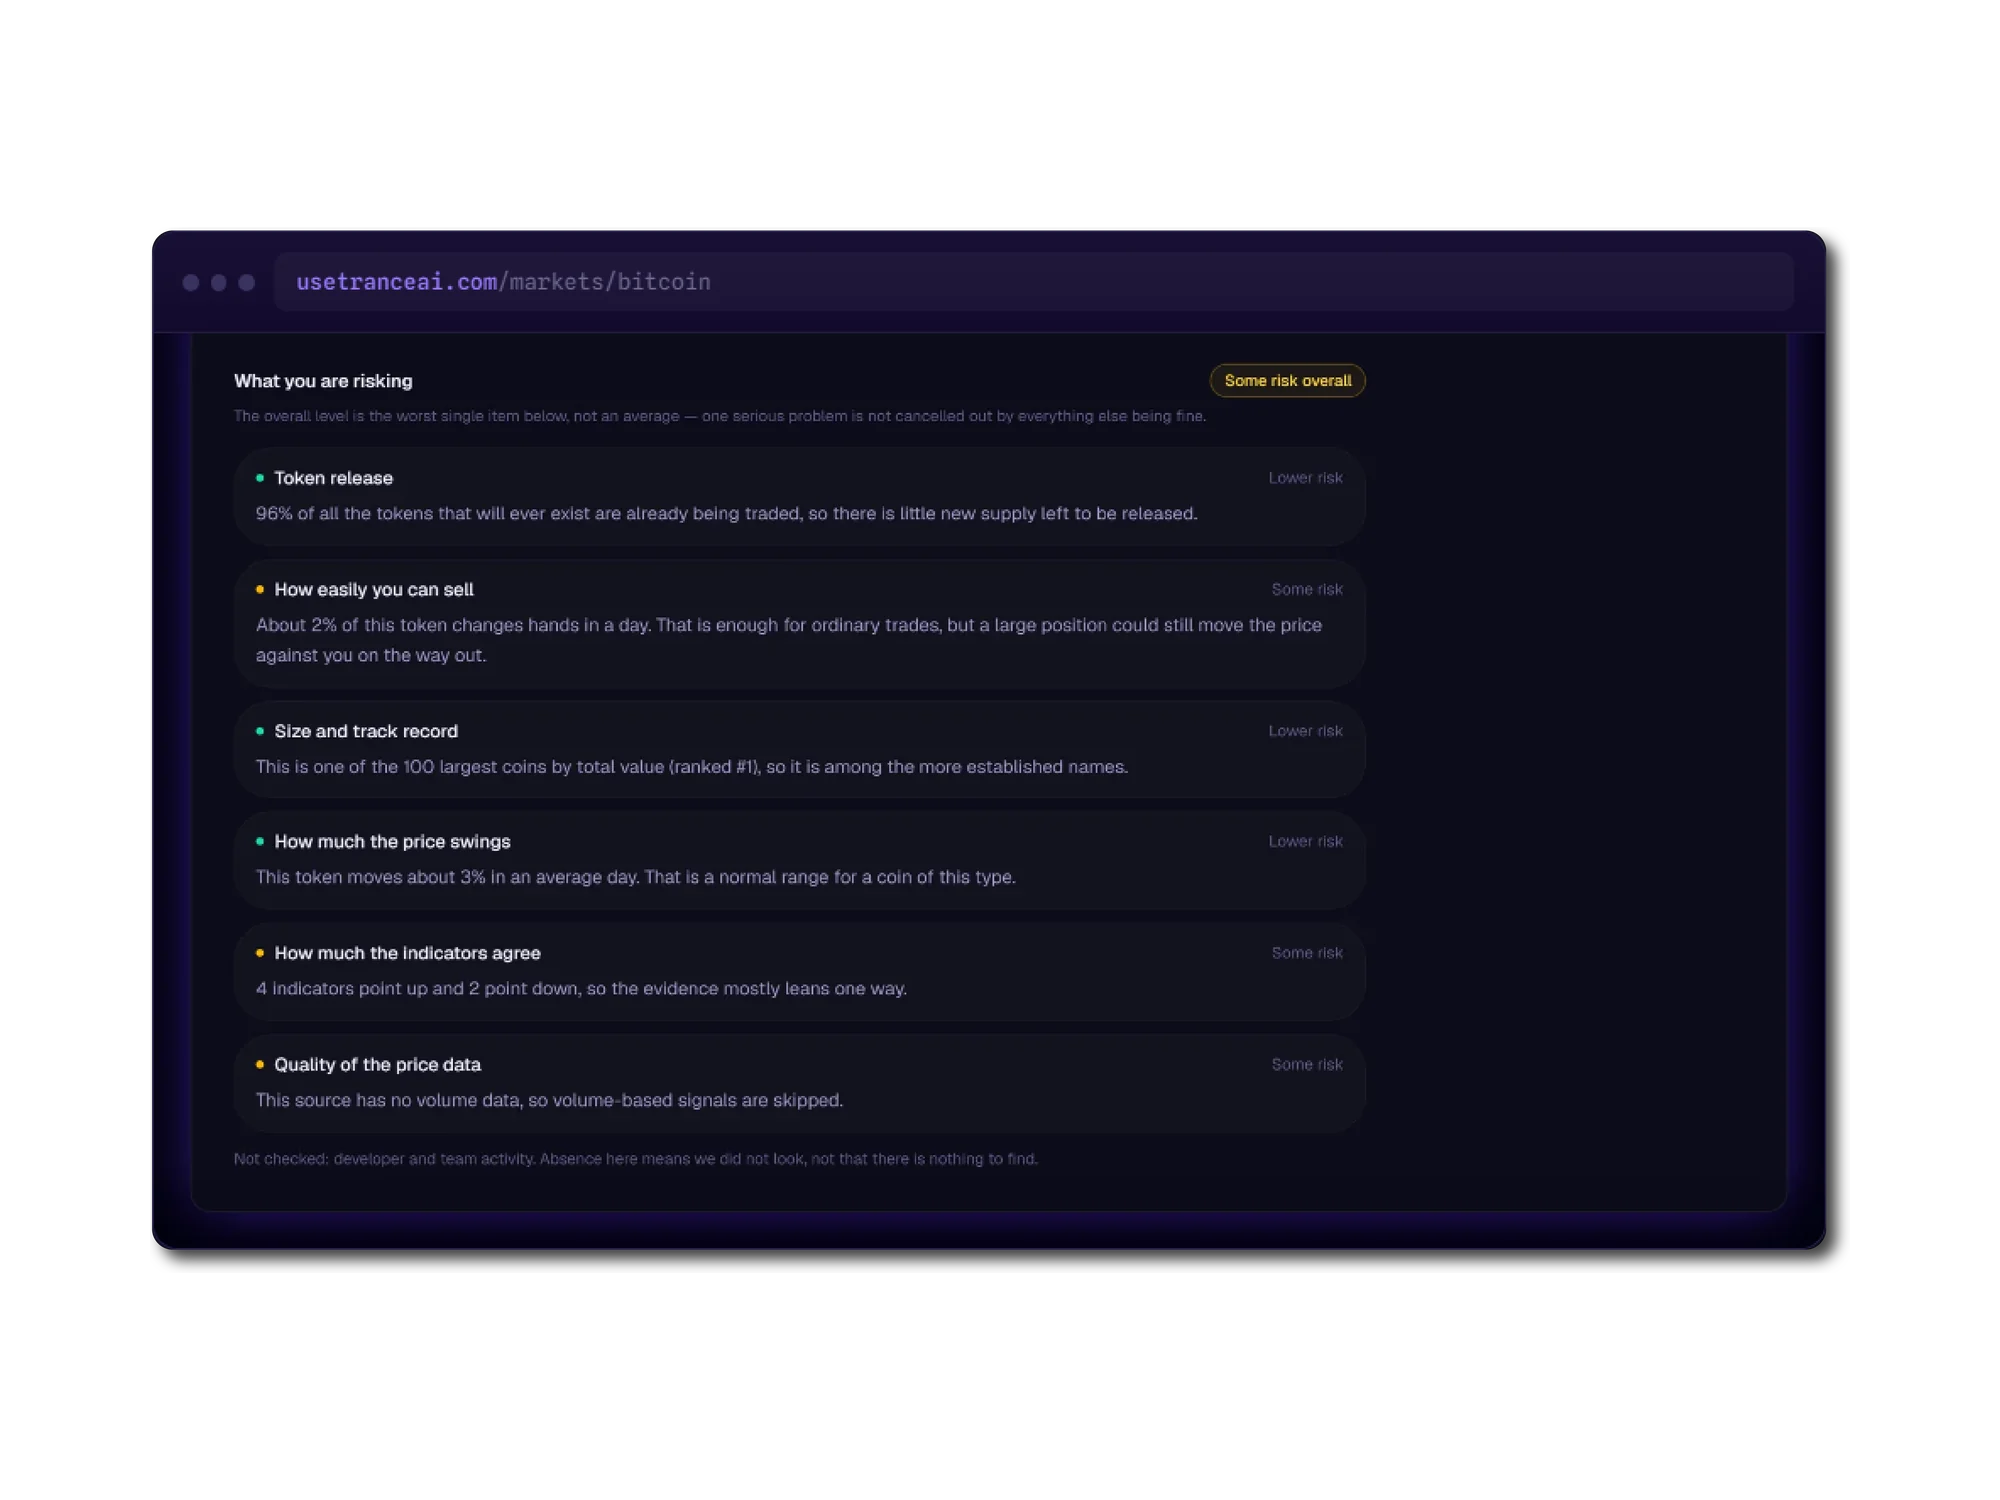
A browser window headed What you are risking, tagged Some risk overall, explaining that the overall level is the worst single item rather than an average. Six rows follow: token release, how easily you can sell, size and track record, how much the price swings, how much the indicators agree, and quality of the price data, each marked lower risk or some risk beside a plain-English sentence. A footnote states that developer and team activity were not checked, and that absence here means it was not looked at rather than that there is nothing to find.
05

What you are risking

Six risk dimensions rated separately and written in sentences a non-specialist can act on. The overall level is the worst single item rather than an average, and the panel names what it did not check.

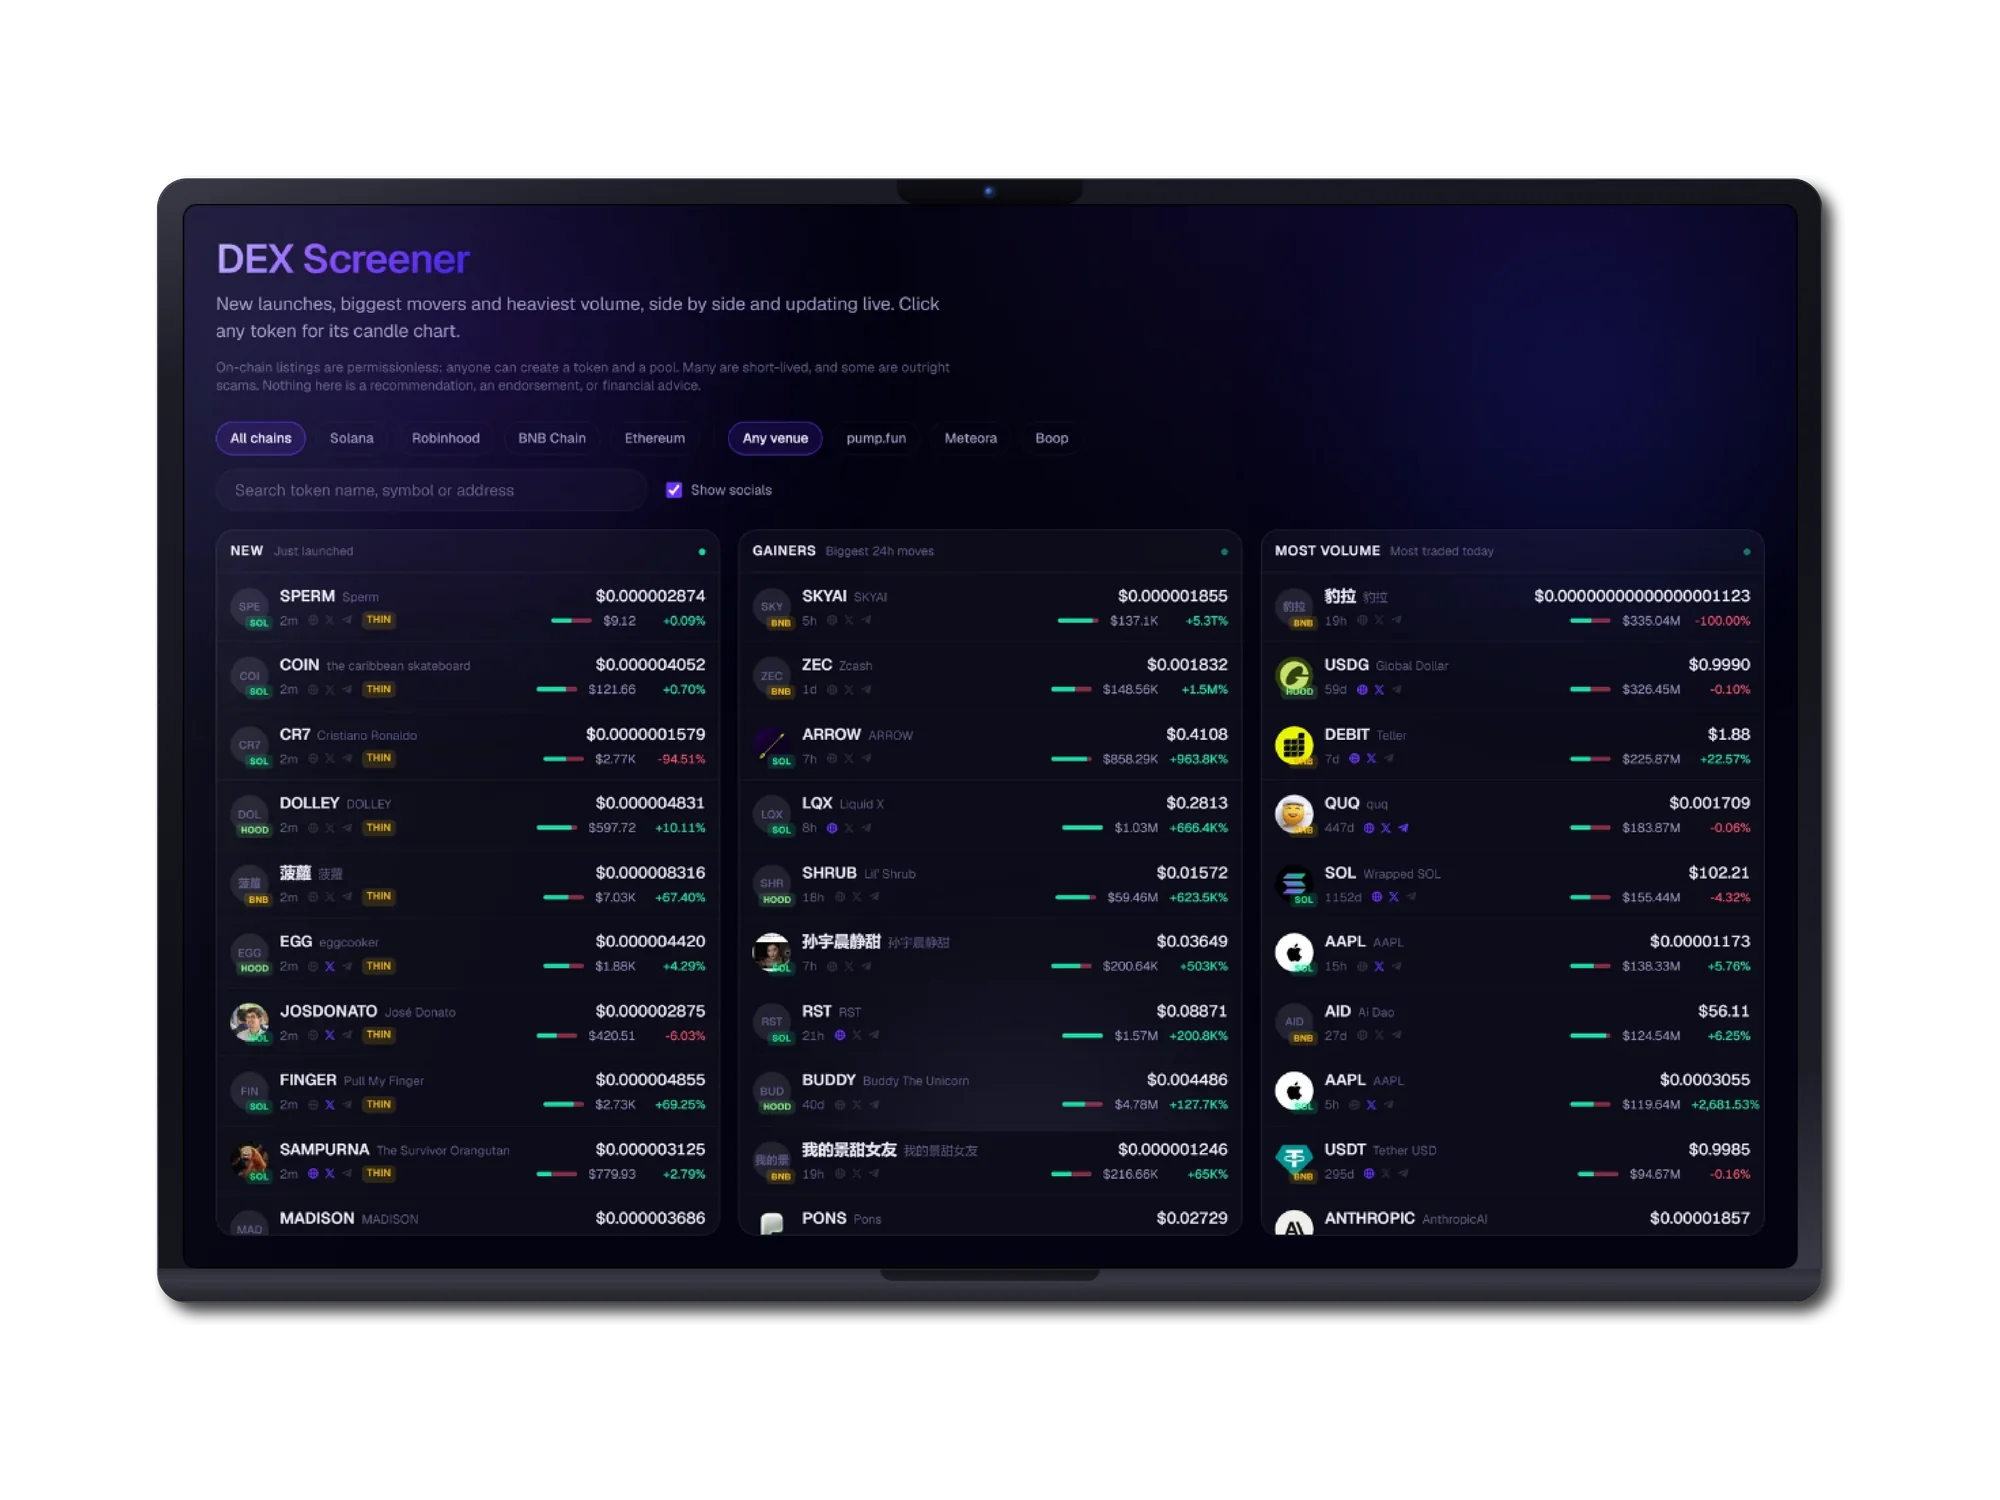
A tablet showing the DEX screener with filter pills for all chains, Solana, Robinhood, BNB Chain and Ethereum, and for venue including pump.fun, Meteora and Boop. A warning notes that on-chain listings are permissionless, that many tokens are short-lived and that some are outright scams. Three live columns follow: New for just-launched tokens, Gainers for the biggest 24-hour moves, and Most Volume for the most traded today, each row carrying a token icon, chain badge, age, price, liquidity and percentage change.
06

DEX screener

New liquidity pools, biggest movers and heaviest volume in three live columns across Solana, Ethereum, BNB Chain and Robinhood, above an unhedged warning that on-chain listings are permissionless.

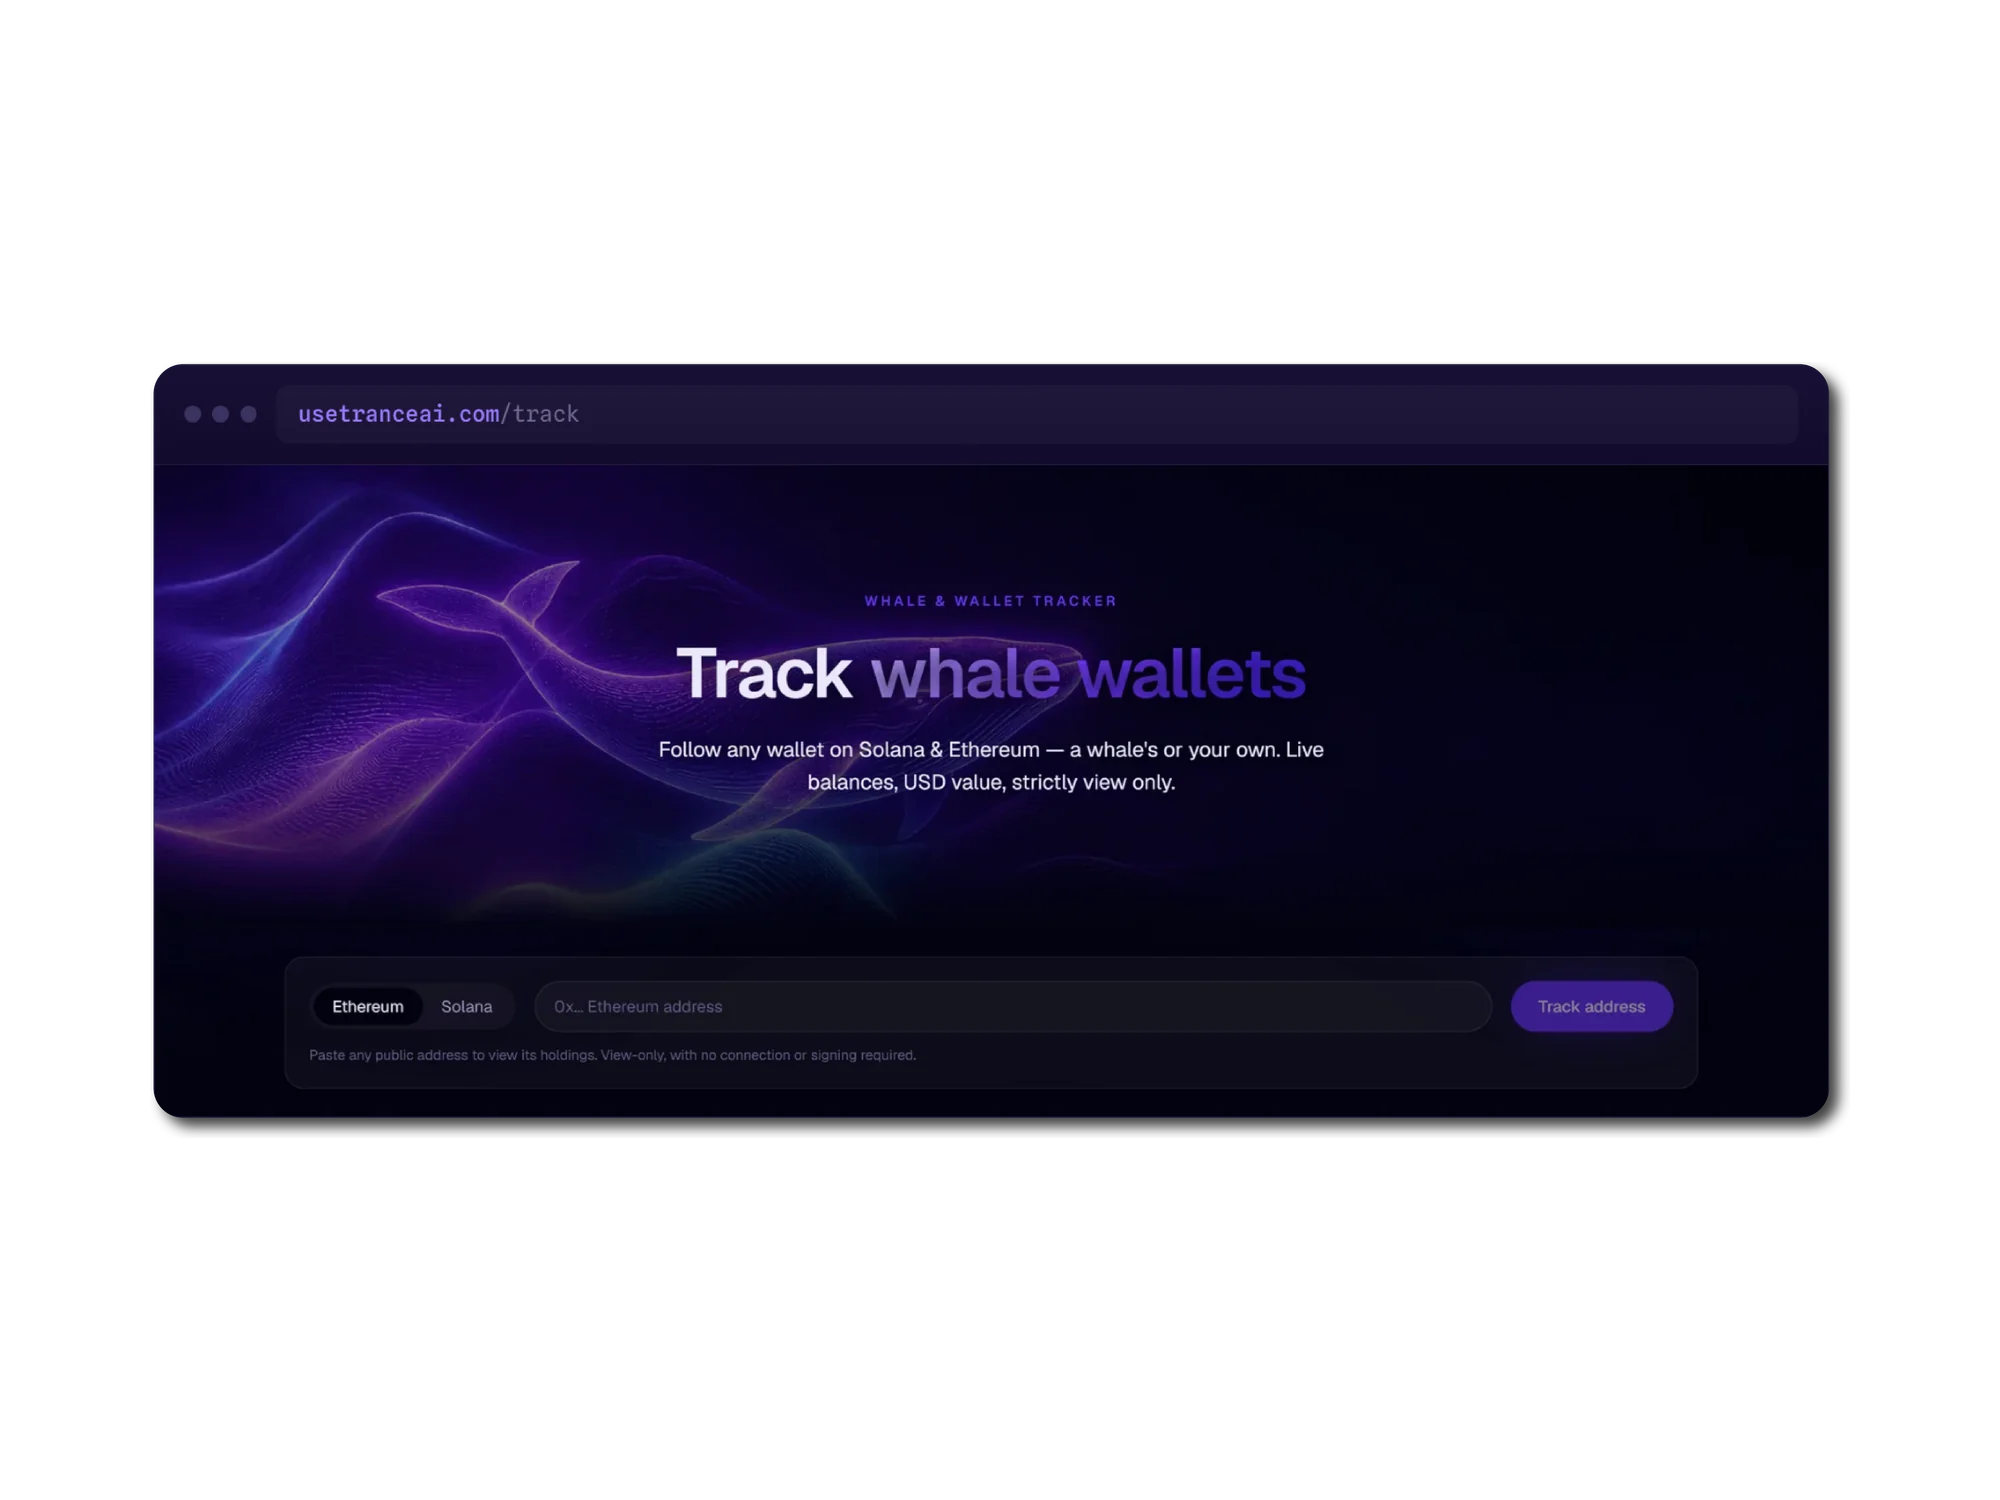
A browser window headed Track whale wallets, over an illustration of a whale rendered in violet and gold line work. The subheading reads follow any wallet on Solana and Ethereum, a whale's or your own, with live balances and USD value, strictly view only. Beneath sits a chain toggle for Ethereum and Solana, an address field, and a Track address button, with a note that pasting any public address shows its holdings view-only, with no connection or signing required.
07

Whale and wallet tracking

Paste any public Ethereum or Solana address to see what it holds. Nothing is connected and nothing is signed, so there is no approval to grant and no key to trust the product with.

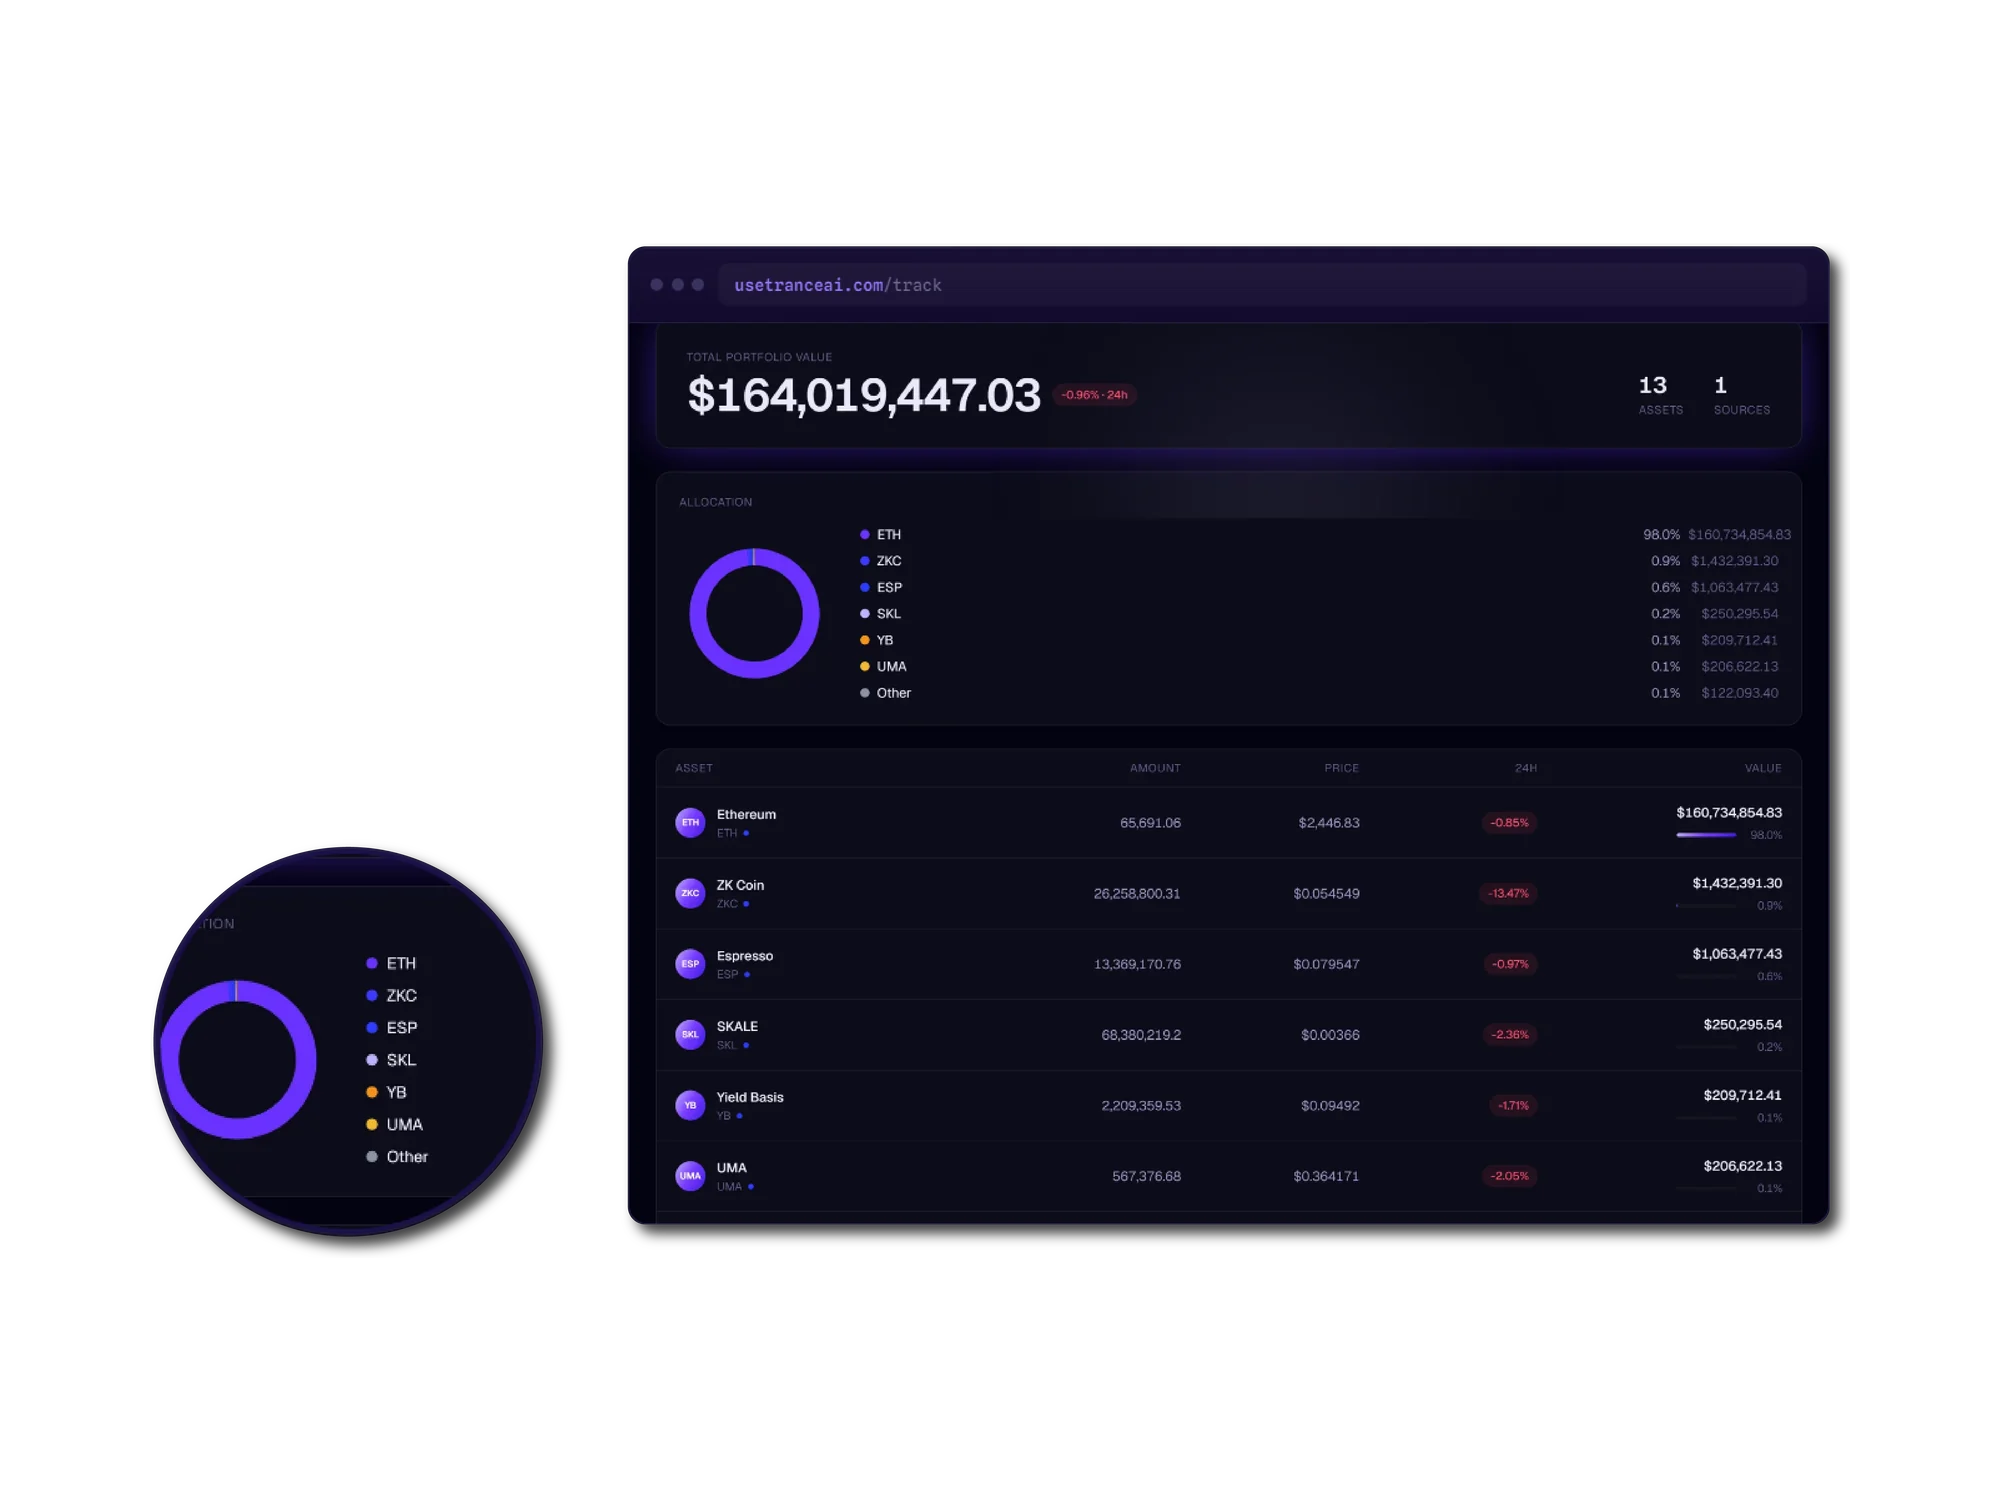
A browser window showing a tracked wallet with a total portfolio value of 164,019,447.03 dollars, down 0.96 percent over 24 hours, across 13 assets from one source. An allocation panel pairs a violet donut chart with a legend giving Ethereum at 98 percent and smaller positions in ZK Coin, Espresso, SKALE, Yield Basis and UMA. A table beneath lists each asset with its amount, price, 24-hour change and value.
08

Portfolio and allocation

A tracked address resolves to a priced portfolio: total value, a 24-hour move, an allocation breakdown, and every holding with its amount, price and share of the whole.

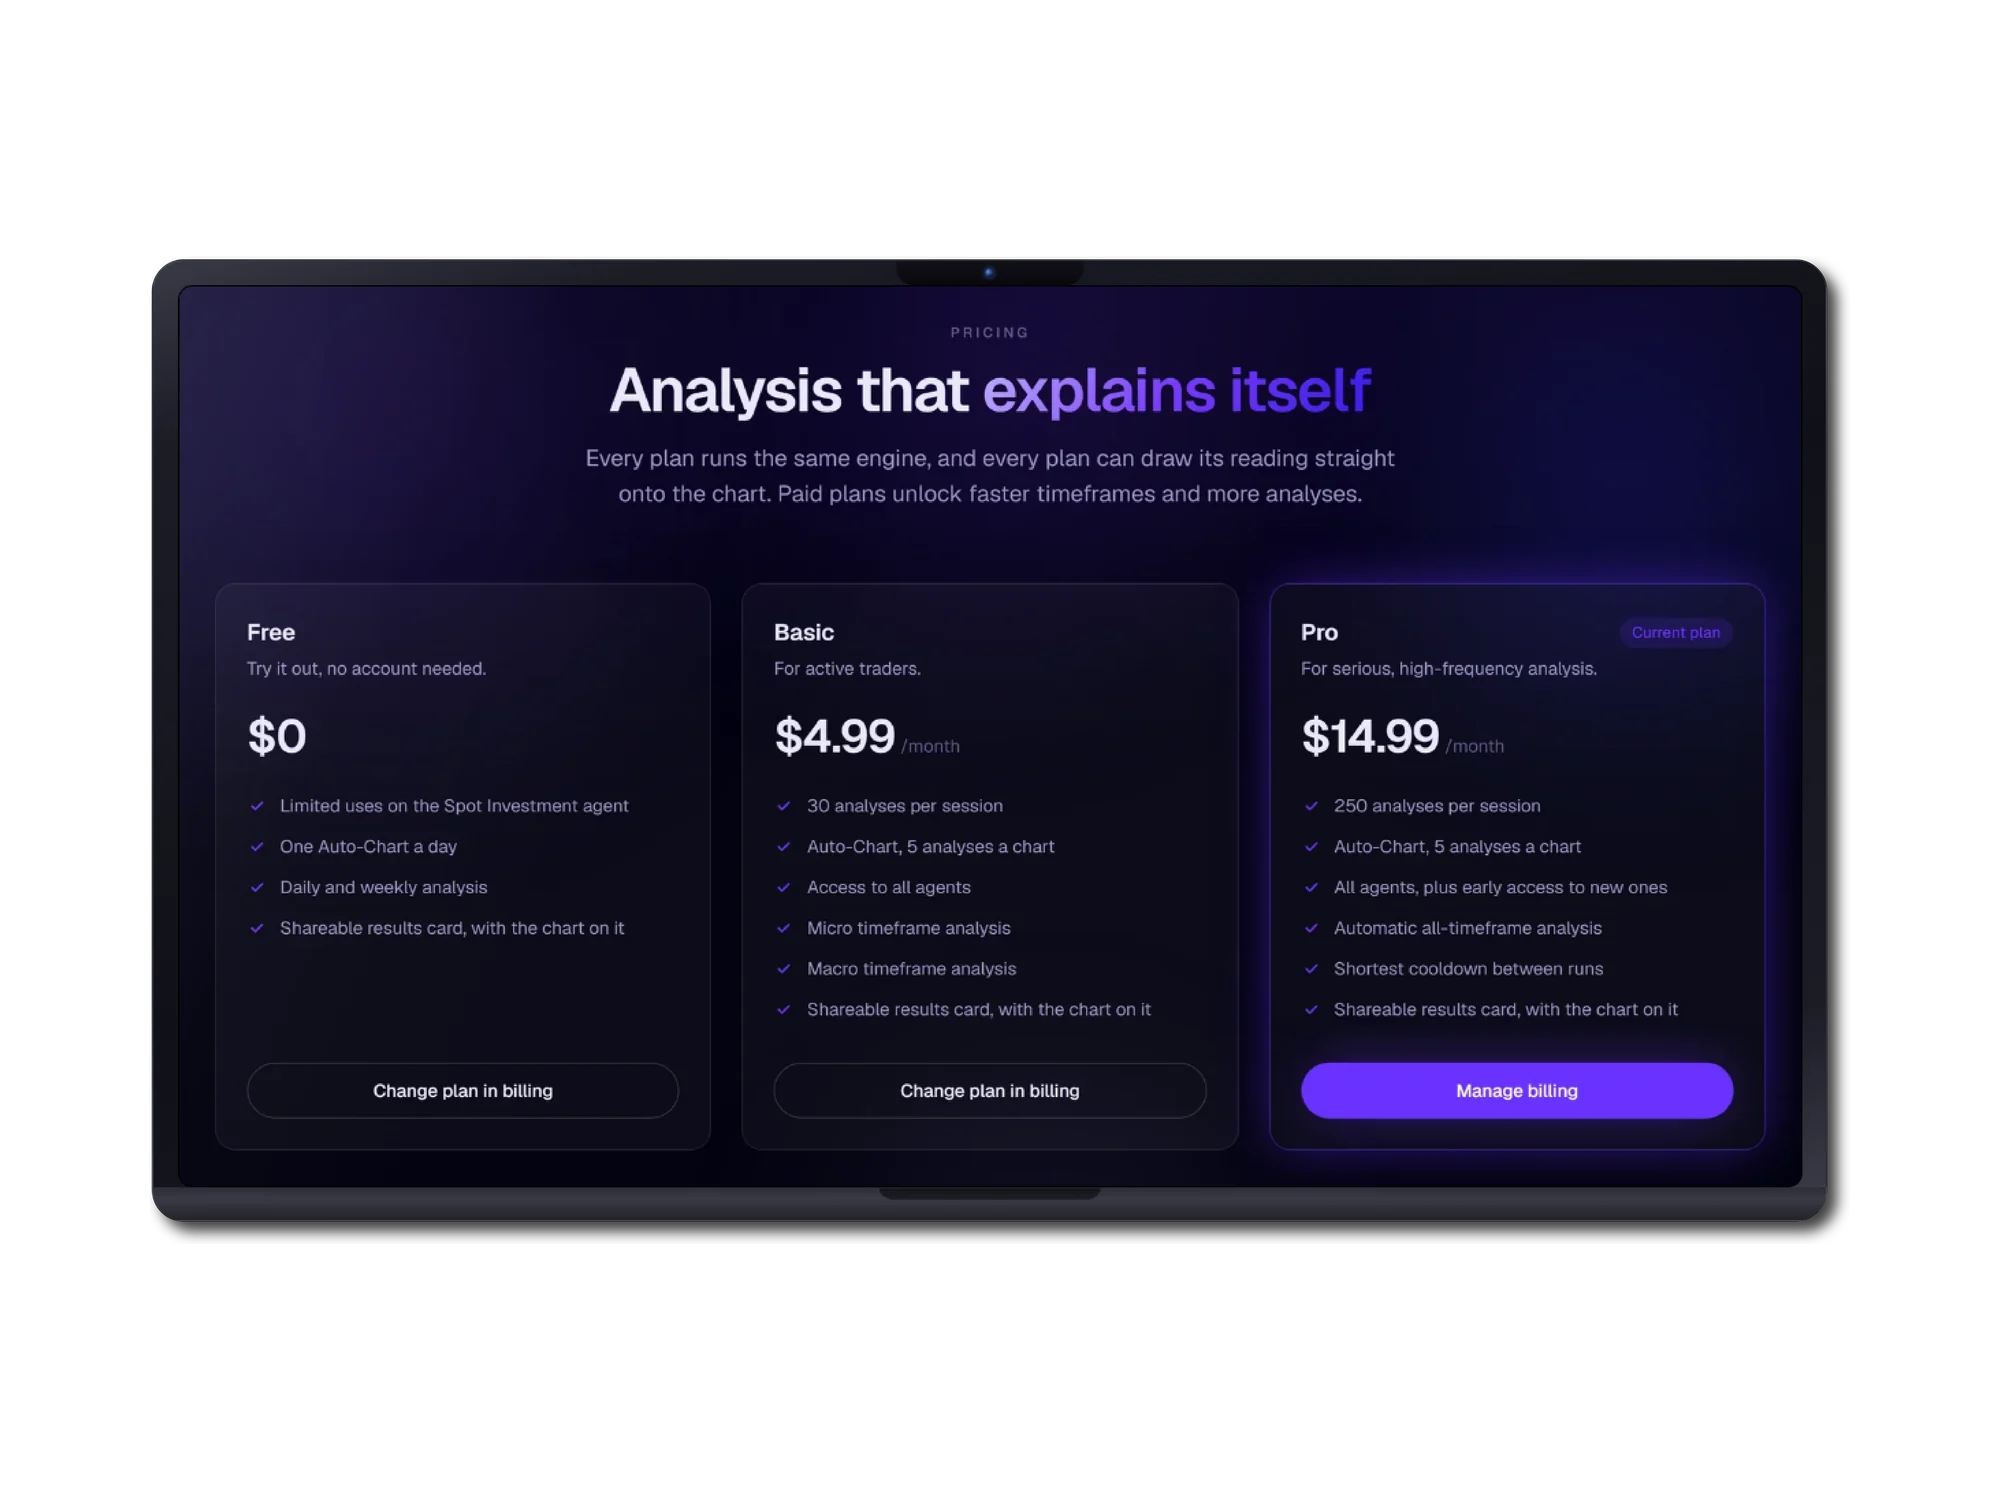
A tablet showing a pricing page headed Analysis that explains itself, noting that every plan runs the same engine and that paid plans unlock faster timeframes and more analyses. Three cards follow: Free at zero dollars with limited uses of the spot agent and one Auto-Chart a day; Basic at 4.99 dollars a month with 30 analyses per session and access to all agents; and Pro at 14.99 dollars a month, marked current plan, with 250 analyses per session and automatic all-timeframe analysis.
09

Three tiers, one engine

Every plan runs the same analysis engine and every plan can draw its reading onto the chart. Paid tiers buy faster timeframes and more analyses, not a better answer.

Challenges

The parts that were genuinely hard

01

A bullish reading is not a buy instruction

The problem

The engine would recommend entering at market precisely when price had run furthest from any support, so the more extended a move already was, the more readily it chased. The client photographed it proposing an entry at the top of a vertical rally.

What we did

The rule read backwards against risk without being obviously wrong: the retestable check asked whether the entry zone sat within a set distance of a level, and the failure branch fell through to entering at market rather than declining to act. That case now proposes no trade. The verdict is untouched, so the reading stays bullish and still explains why, but the instruction becomes wait, carried through the app by an existing field rather than a new one. It is applied symmetrically to shorts.

The outcome

The product stopped conflating a market observation with a trade recommendation, which is the distinction its credibility rests on.

02

The chart and the prose could drift apart

The problem

The analysis is written in one place and drawn in another, and nothing stopped a chart label from showing a rounded, stale or invented figure that contradicted the paragraph beneath it. There is no natural point where a human notices 61.8 percent quietly becoming 62 percent, and a reader who spots the two disagreeing has no way to know which to trust.

What we did

A test asserts that every digit appearing in a chart label traces back to a value the engine computed, including the per-level fibonacci captions, which are the largest cluster of numbers on the chart. It was validated by mutation: hard-coding a touch count and rounding a fibonacci caption both fail it.

The outcome

The chart has nothing of its own to say. The guarantee is mechanical rather than a convention someone eventually forgets.

03

Drawings that were correct and invisible

The problem

Running the charting feature end to end on Cardano revealed that five of six fibonacci levels were drawn off-screen, and a sixth had vanished entirely. Neither defect appeared in the unit tests and neither logged anything. The geometry was right; the view was wrong.

What we did

The macro fibonacci was anchored across 300 daily candles while the chart opened on a 90-day window, and the label separation pass only ever pushed labels downward, so levels arriving bottom-to-top cascaded off the pane. The timeframe snap became profile-aware, so a daily spot analysis opens on a one-year chart wide enough to contain what it describes, and label positions are now resolved and sorted before anything is drawn.

The outcome

All six levels render in view, every drawn level is labelled, and the fix carries a regression test that fails without the sort.

04

A cost figure that contradicted itself

The problem

The daily AI-cost view reported figures that could not both be true, such as eleven AI calls against a cost of 0.0016 dollars. It was the single number used to watch AI spend against subscription revenue, so being quietly wrong mattered more than being obviously broken.

What we did

Cached results were settling under the original provider's name, so a cache hit, which makes no API call and costs nothing, was counted as one. It is fixed at both ends: the route now settles cache hits under their own provider, and the view no longer trusts the provider field alone to mean a call was made.

The outcome

Deliberately redundant, because the number is money, and a view that is only correct while every caller remembers a convention will eventually be wrong.

Approach

How the work ran

  1. 01

    Discovery and research

    Requirements arrived as working sessions rather than a specification, and several are preserved verbatim in the commit history, including the client's own words about bullish readings not being entry signals. Significant features were written up as dated design documents before implementation.

  2. 02

    UI/UX design

    A dark, chart-first interface built with Tailwind CSS v4 and a small set of shared primitives. Interface decisions were made against real market data throughout, which is how defects like off-pane chart labels surfaced at all: by running the feature end to end rather than by unit test.

  3. 03

    Development and testing

    Incremental delivery across 184 commits, with tests written alongside the analysis engine, the highest-risk code, rather than after. Database changes ship as reviewable, re-runnable SQL migrations, fourteen in total, each carrying a comment explaining why it exists.

  4. 04

    Deployment and support

    Deployed on Vercel with environment-driven configuration, so the application builds and runs with no secrets present, and degrades feature by feature when a service is unconfigured rather than failing to start.

Features

What shipped

Two specialist agents

A spot agent for holding decisions and a perpetuals agent for market structure, each with its own timeframe set and its own rules about what it will and will not claim.

Auto-Chart

The engine draws its own reading onto the candles: support and resistance as zones with touch counts, a labelled fibonacci set, channels, flags, and trendlines projected forward.

Plain-English risk

Six risk dimensions rated individually and described in sentences a non-specialist can act on, with the overall level taken as the worst single item rather than an average, plus an explicit note of what was not checked.

Multi-venue candle sourcing

Price history is assembled from three sources behind one registry, with roll-up aggregation and gap repair, so a chart is available even where a single venue's history is thin.

View-only wallet tracking

Any public Ethereum or Solana address resolves to a priced portfolio with an allocation breakdown. Nothing is connected and nothing is signed, so there is no approval to grant.

Abuse-resistant metering

Usage limits are enforced inside a single Postgres function, per session and per day with a cooldown and a free-tier IP cap, reserving credit before work begins and settling after, so limits cannot be bypassed by racing the application layer.

Results

Measured, not estimated

314

Automated tests

Across 35 files, concentrated on the analysis engine, where a silent numerical error would be the most expensive and the least visible.

13

Production dependencies

Charts, state and data access are hand-built rather than pulled in, keeping the dependency surface, and its upgrade and security burden, deliberately small.

Two caps

Bounded AI spend

Spend degrades to a deterministic writer at a soft daily cap and stops entirely at a hard cap, both environment-configurable, so cost stays predictable as traffic grows.

Build something that explains itself

From deterministic engines to interfaces people trust. Tell us what you are building and we will show you how we would ship it.

Have a Project To Discuss?

Contact Us