Restaurant operations

Stock that warns you first

A multi-tenant inventory and logistics platform that predicts stockouts, flags waste before it adds up, and generates purchase orders on its own. Built for restaurants running one location or ten.

Restaurant TechAI Rule EngineMulti-Location SaaSNext.js
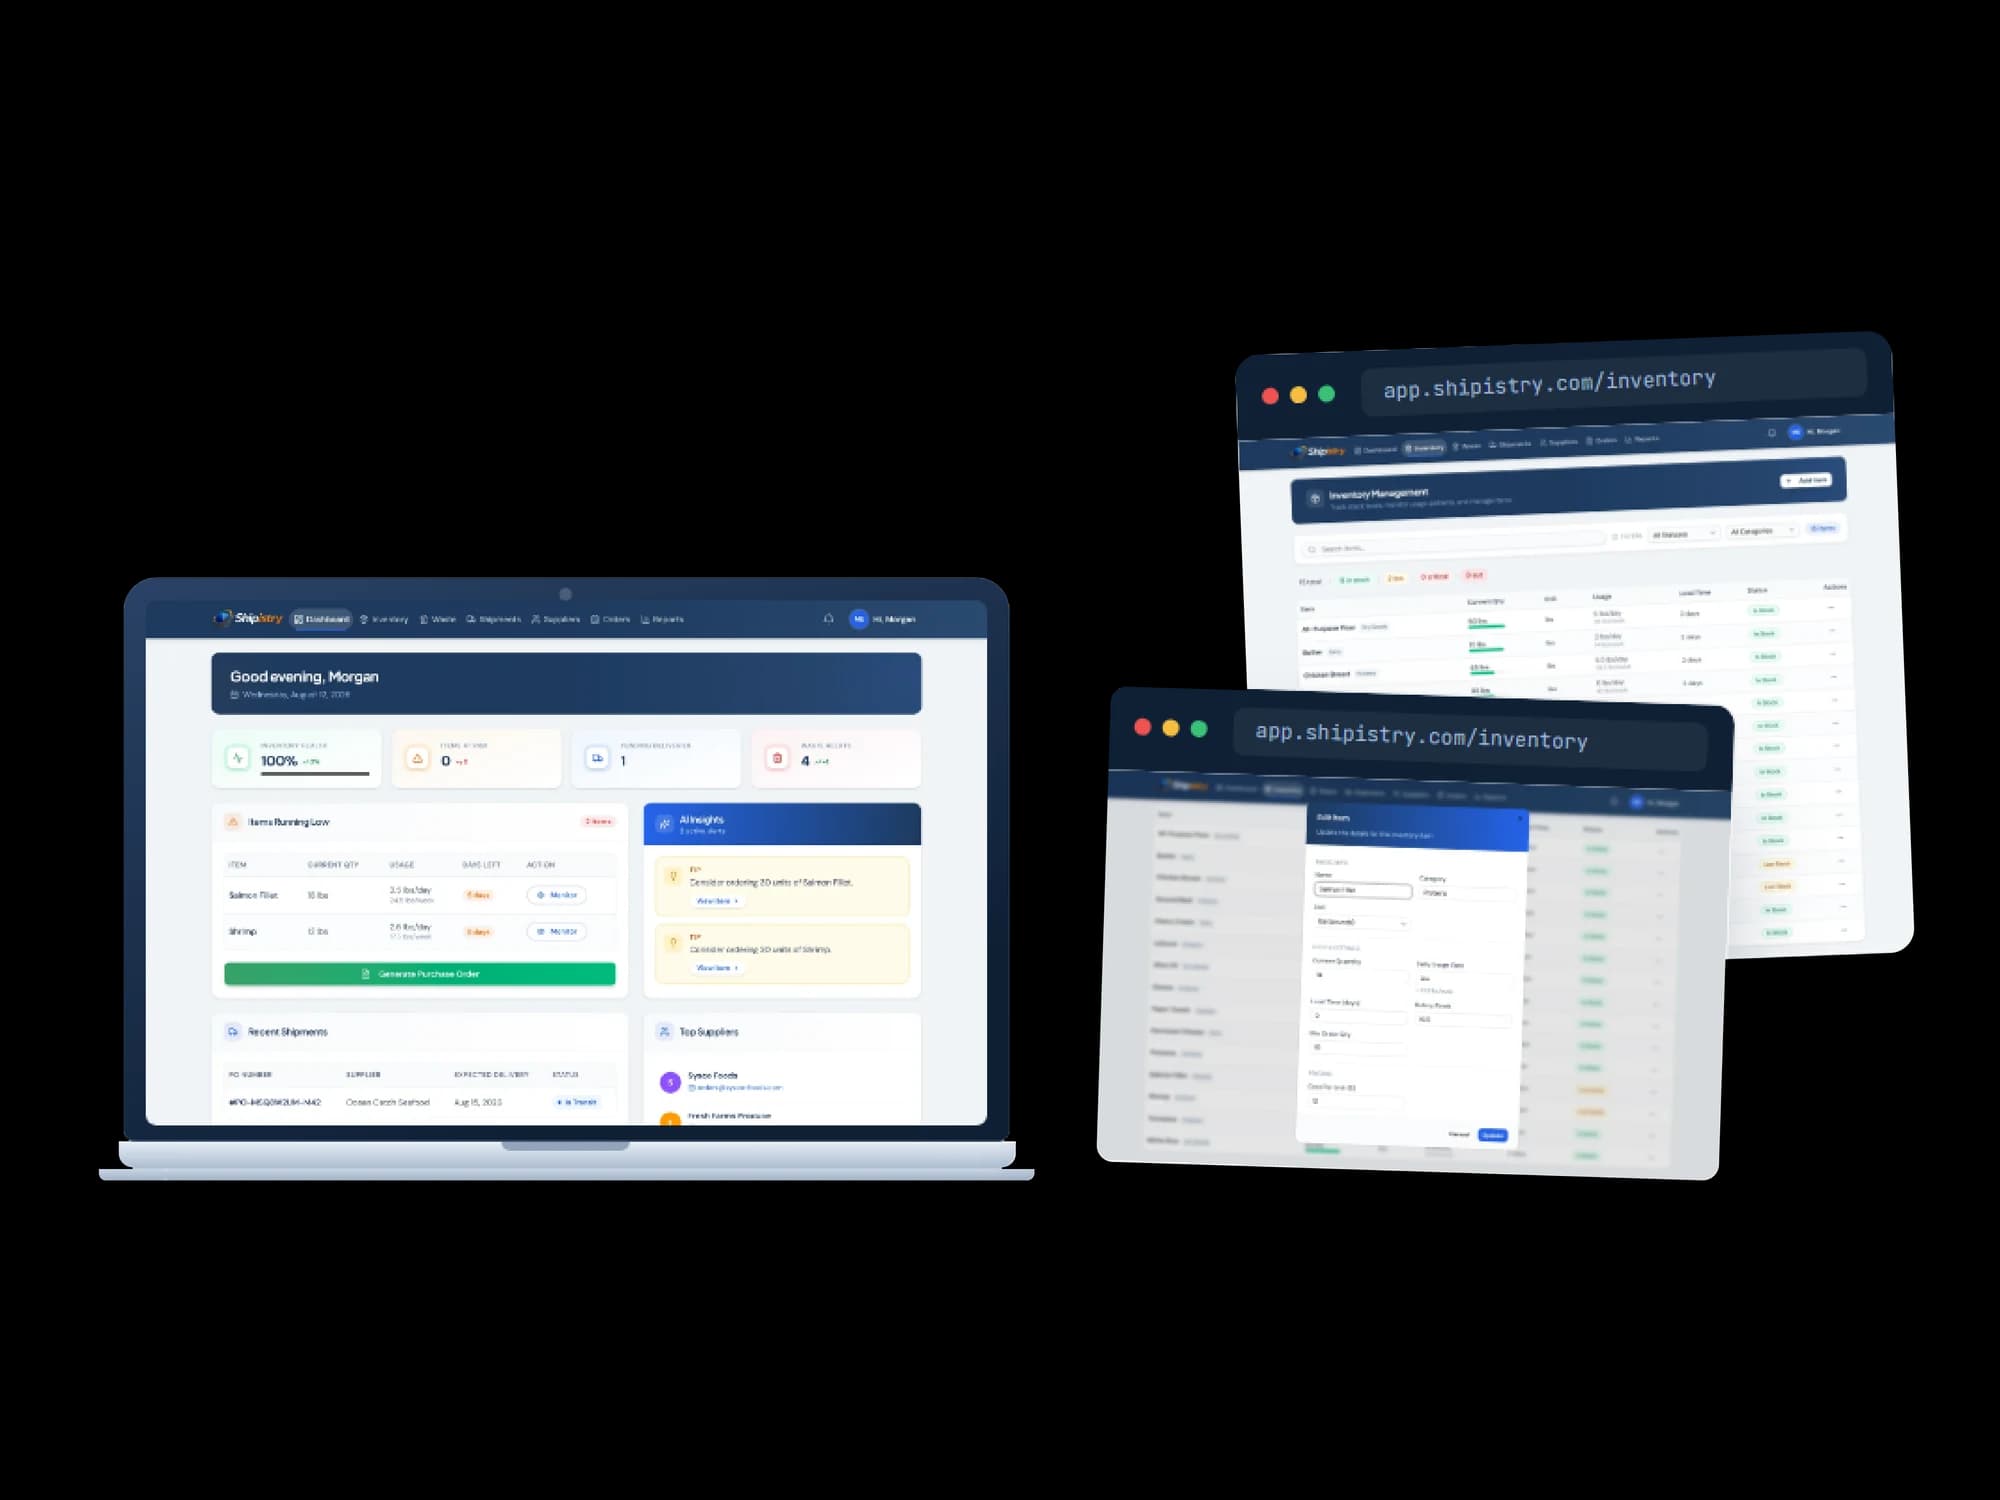
Shipistry shown across a laptop and two browser windows
About the product

AI Supply Intelligence for Modern Restaurants

Independent restaurants and small multi-location groups still run inventory the way they did a decade ago. A manager eyeballs the shelves, guesses at reorder quantities, and learns about a shortage when the walk-in is already empty. Shipistry replaces that guesswork with a rule-based engine that watches every item's consumption, works out when it will run out, and says what to order and from whom before it turns into a problem.

The build is one application covering the whole loop: onboarding, inventory and supplier management, AI-generated purchase orders, shipment tracking with automatic restocking, waste logging, demand forecasting from point-of-sale history, and a nightly job that re-runs the engine for every location and emails the results. Every table in the 15-table schema is scoped to a company and, for operational data, to a location, with Postgres row-level security enforcing that boundary in the database rather than only in application code.

What an operator gets is a dashboard that already knows what is wrong before they log in. Which items are about to run out, which supplier is cheapest for the reorder, which shipment is running late, and which items are quietly costing more in waste than the threshold allows. Each of those calls comes from one of seven deterministic formulas, not a black box.

Industry
Restaurant and foodservice operations
Platform
Responsive web app with an admin portal
Timeline
About four months, kickoff to production
Team
One full-stack engineer, end to end

What we did

  • UI/UX design
  • Full-stack development
  • AI rule-engine design
  • Third-party integrations
  • Production deployment

Stack

Next.js 16TypeScriptReact 19Tailwind CSS v4shadcn/uiSupabaseStripeResendRechartsjsPDF
Goals

What the build had to achieve

Stop stockouts before they happen

Every item gets a reorder point computed from its daily usage, lead time, and safety stock, plus a stockout-risk score comparing days of stock left against how long a delivery takes. A shortage shows up as a dashboard warning days before the shelf is actually empty.

Turn waste into a visible cost

Waste and damage are logged per item and rolled up against a per-company threshold. Anything over that line surfaces as a flagged alert with its dollar cost attached, instead of disappearing into a general shrinkage number at the end of the month.

Make ordering automatic

Purchase orders are generated for the operator, sized from real reorder math and grouped by whichever supplier is cheapest for the items involved. The reorder decision drops to a review and a send.

One login, cleanly separated locations

A restaurant group gets a single login, per-location scoping enforced at the database level, and a manager role that can run day-to-day operations without touching billing, user management, or another location's data.

Inside the product

Shipistry, screen by screen

A laptop showing the Shipistry dashboard with a Good evening Morgan banner, an inventory health card at 100 percent, an Items Running Low table listing salmon fillet and shrimp, an AI Insights panel holding two reorder tips and a green Generate Purchase Order button, beside two browser windows on the inventory page, one with the item table and one with the Edit Item dialog open.
01

Live dashboard and inventory

The operator lands on inventory health, the items running low with days of stock left, and the AI insight tips behind them, with the full item table one tab away.

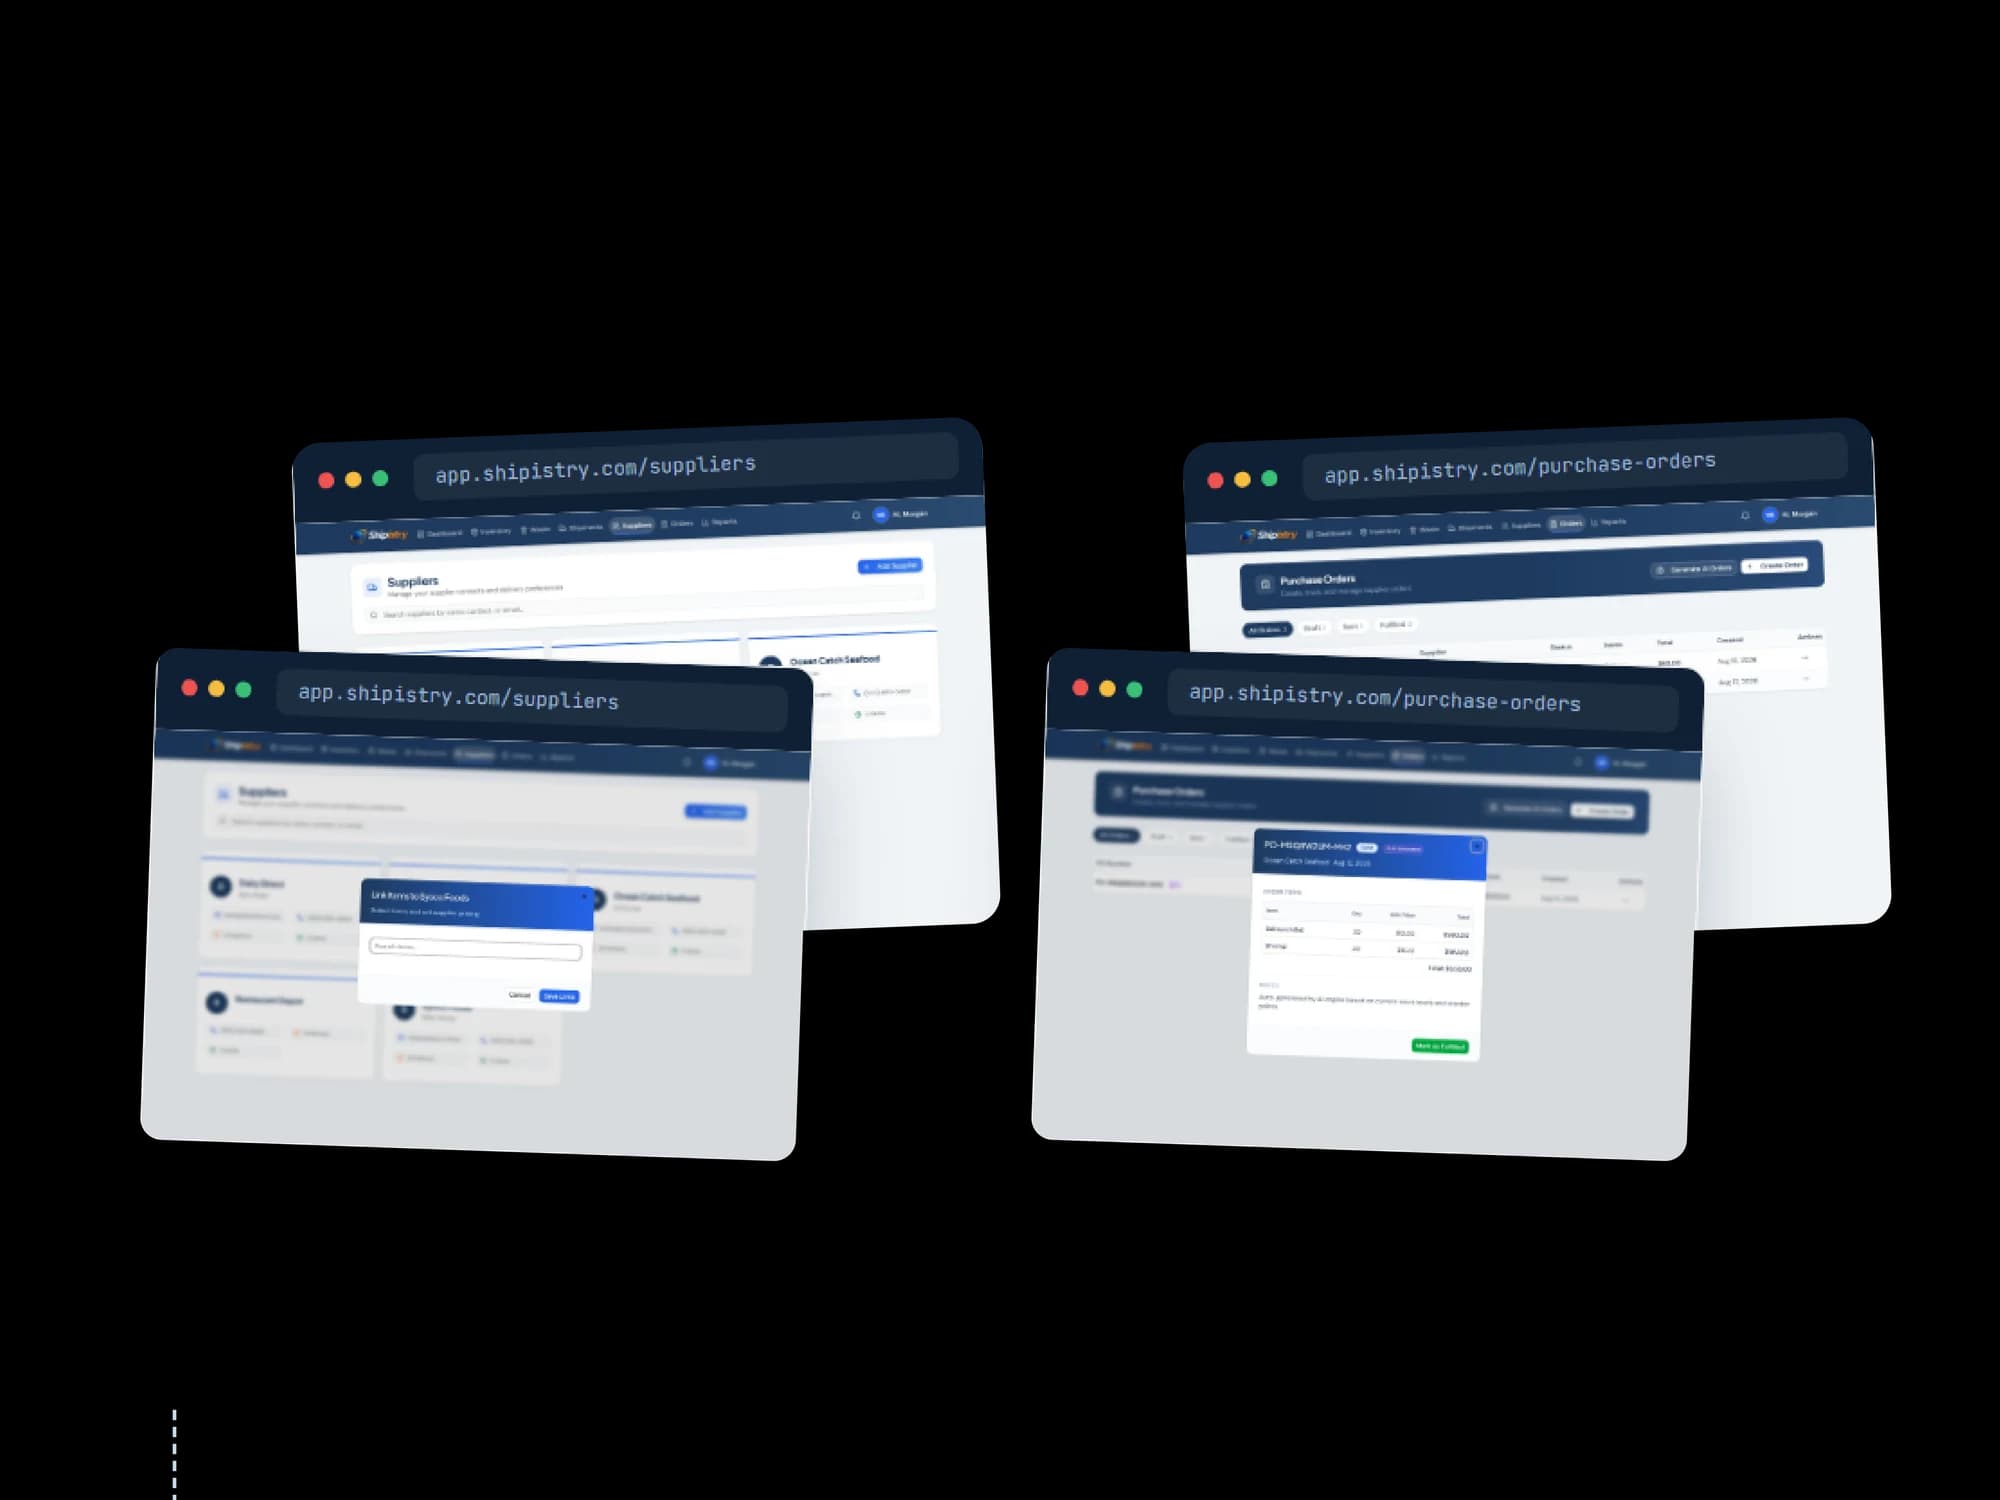
Four browser windows: a supplier directory of vendor cards with a Link Items to Sysco Foods dialog open, and the purchase orders list with an AI-generated order for Ocean Catch Seafood expanded to show two seafood line items, an order total, and a Mark as Fulfilled button.
02

Suppliers and purchase orders

Vendors are linked to the items they price, so the reorder arrives already drafted under the cheapest supplier and waits for a person to send it.

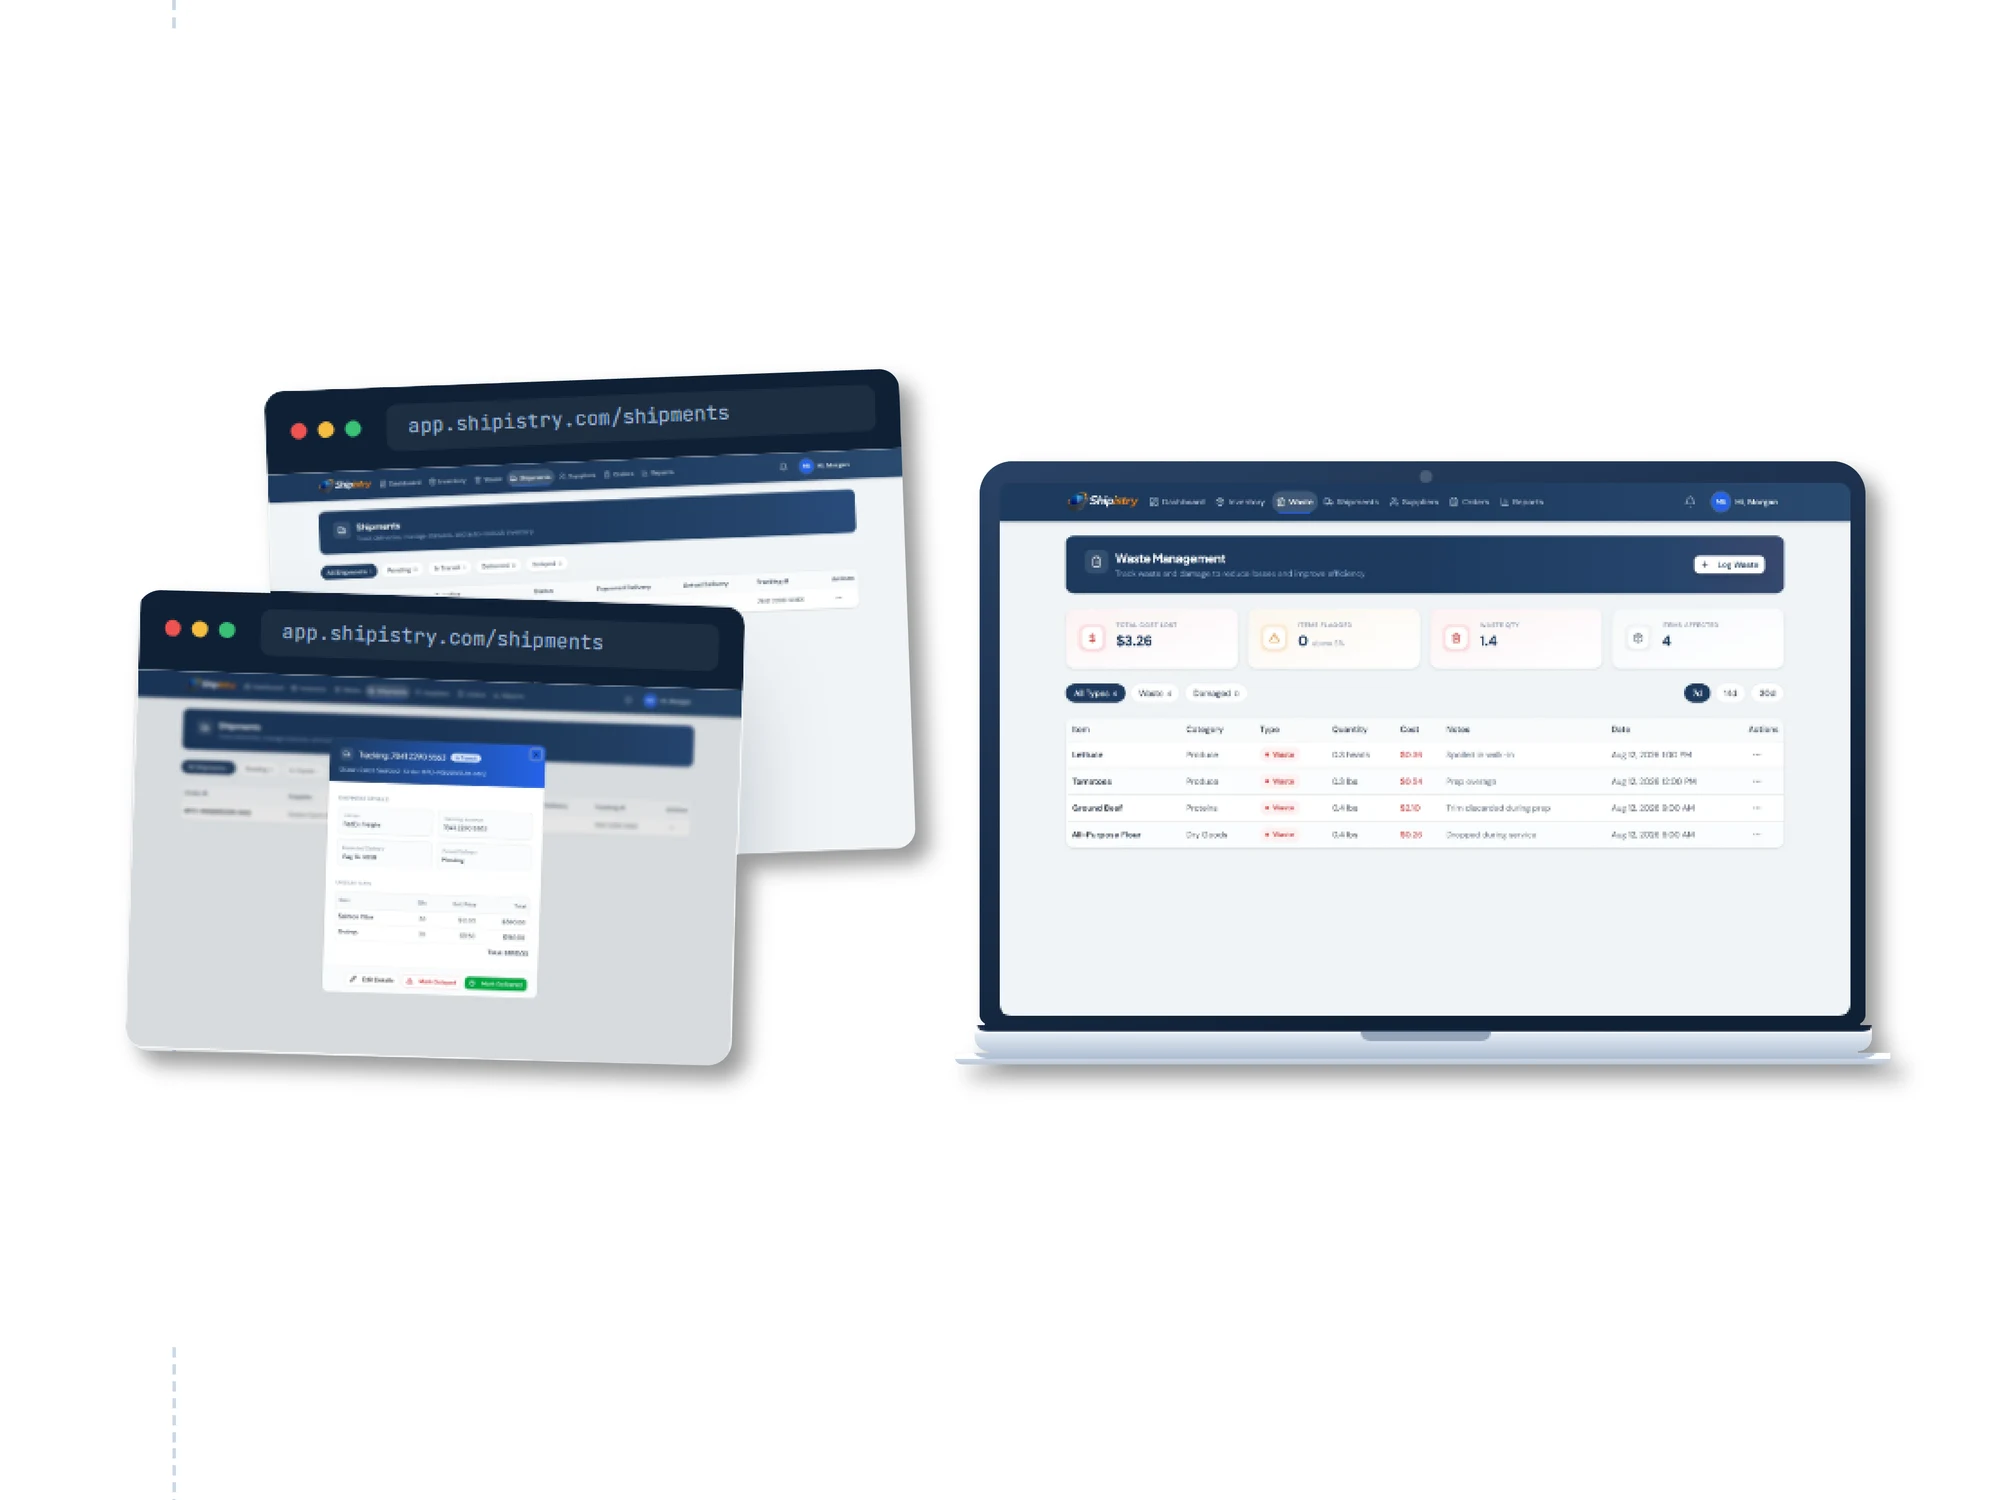
Two browser windows on the shipments page, the front one showing a tracking dialog with carrier, expected delivery, order lines, and Mark Delayed and Mark Delivered buttons, next to a laptop showing Waste Management with cards for total cost lost, items flagged, waste quantity, and items affected above a log of four entries for lettuce, tomatoes, ground beef, and all-purpose flour.
03

Shipment tracking and waste

A sent order becomes a tracked shipment with a carrier, a tracking number, and a delivery date, while every spoiled or damaged item is logged against its cost.

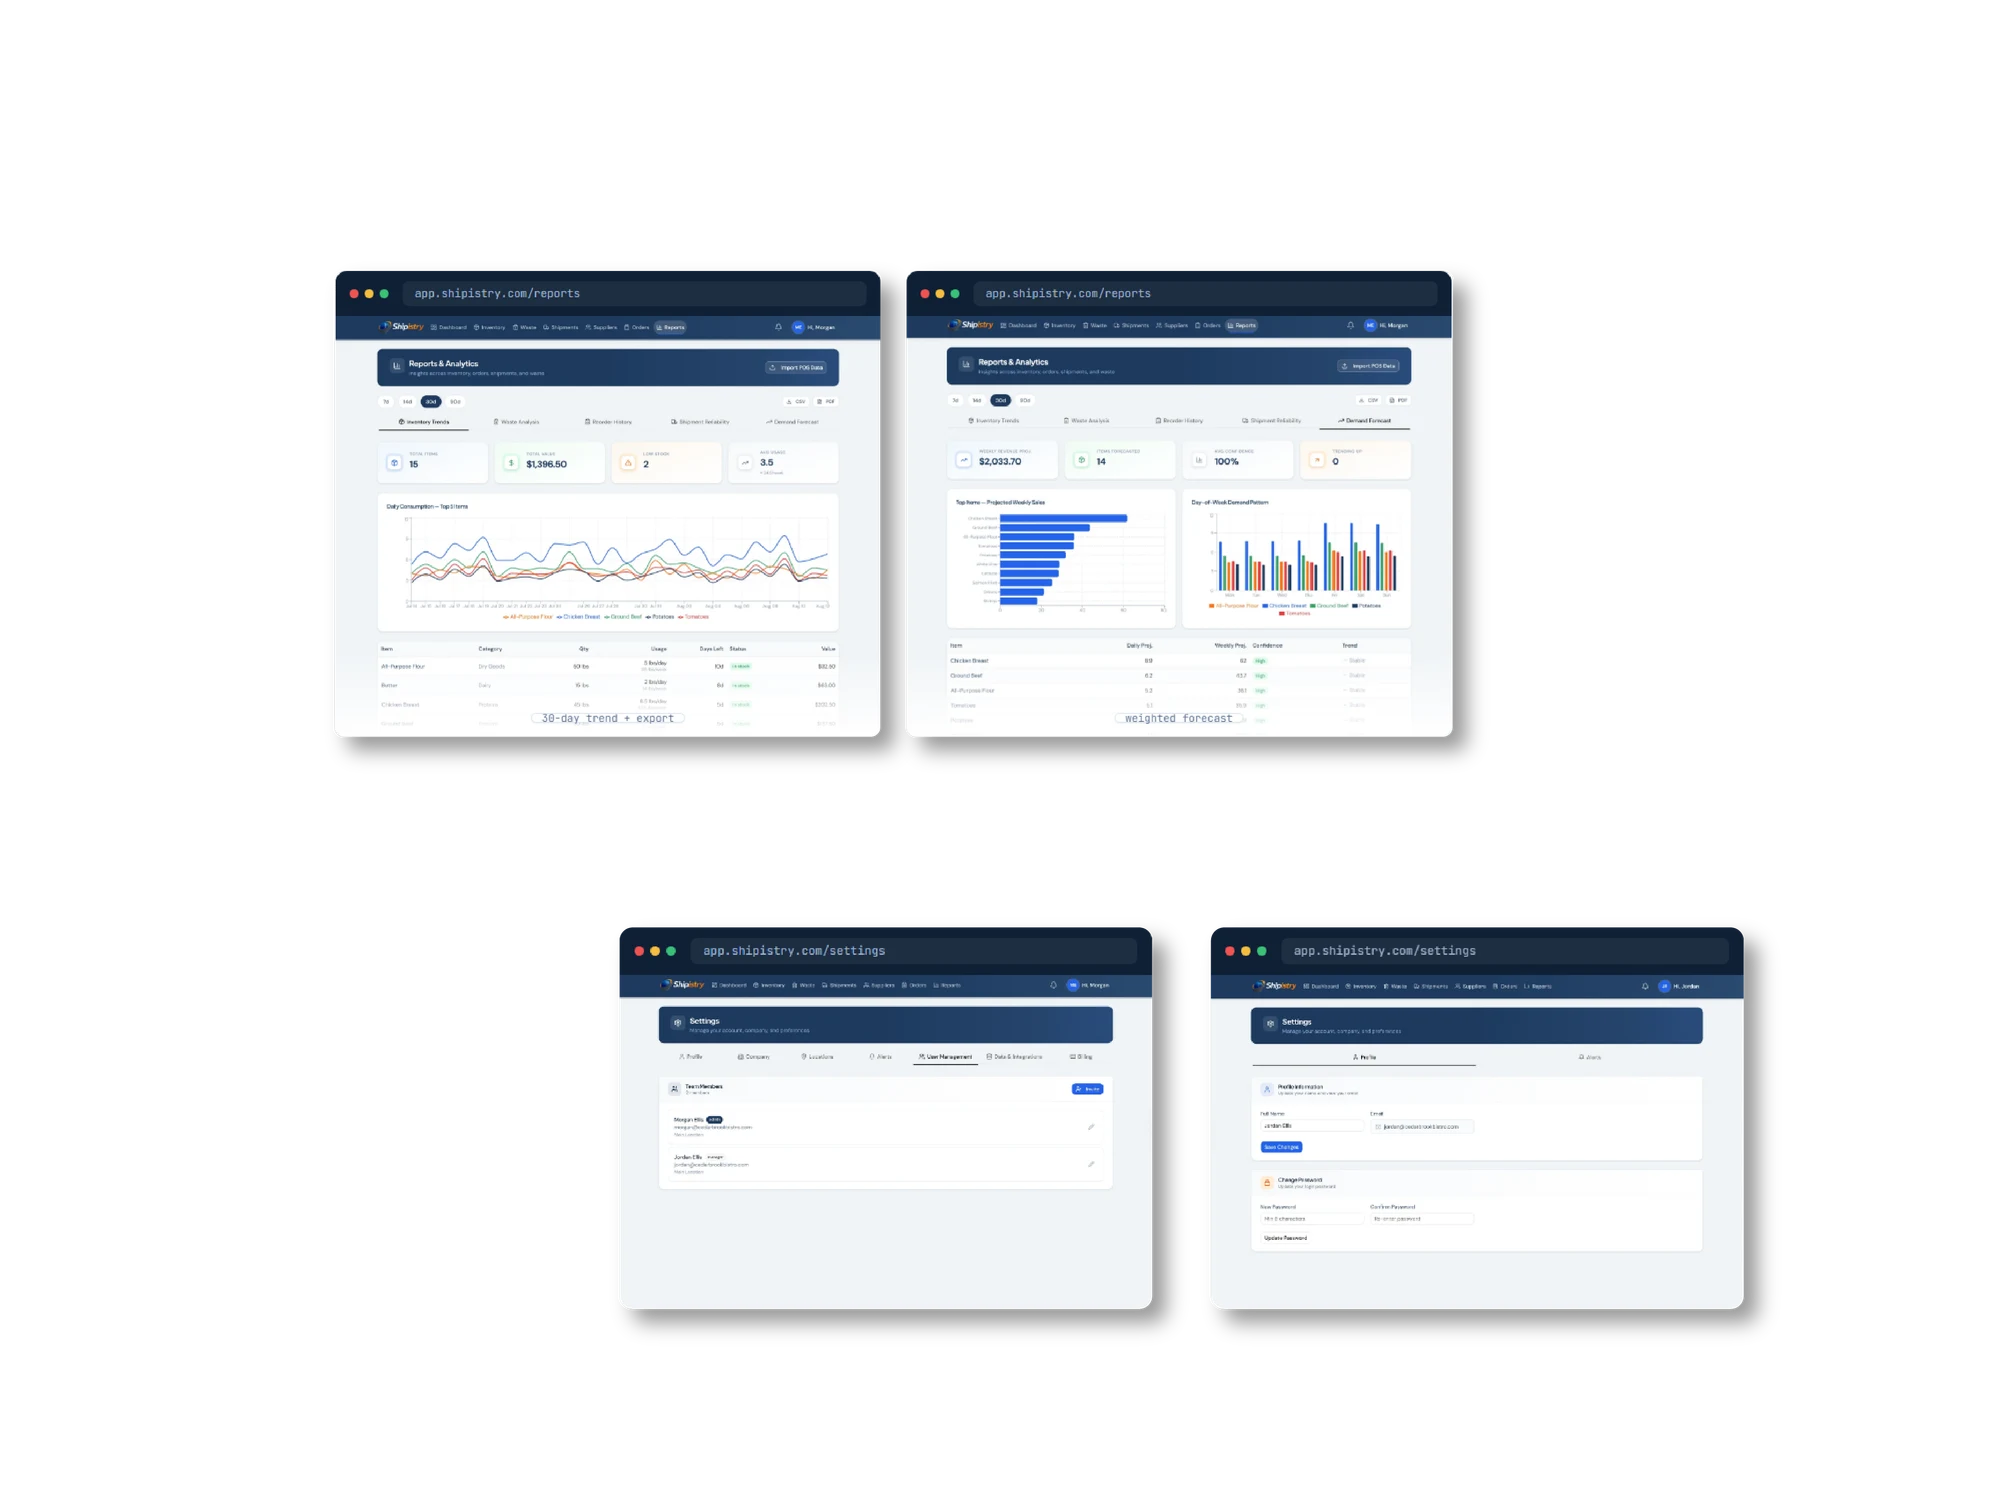
Four browser windows: an Inventory Trends report with a daily consumption line chart and an item value table, a Demand Forecast report with projected weekly sales bars and a day-of-week demand chart, a settings page on the User Management tab listing two team members, and the same settings page for a manager account showing only Profile and Alerts.
04

Reports and role-scoped settings

Thirty-day consumption trends and a weighted demand forecast both export to CSV or PDF, and the same settings page shows seven tabs to an owner and only two to a manager.

Challenges

The parts that were genuinely hard

01

An engine that knows when to stay quiet

The problem

Usage-spike detection and cross-location variance are statistically meaningless on thin data. A naive build would show a confident number off two weeks of history, be wrong, and lose the operator's trust the first time they checked it against reality.

What we did

Each rule declares its own data preconditions, four or more weeks of history for spike detection and two or more locations for variance, then skips silently when they are not met.

The outcome

Every insight on the screen is one the system has the evidence to back, so operators act on the alerts instead of second-guessing them.
02

Automating the reorder without taking away the decision

The problem

Restaurants will not hand a piece of software a purchasing budget. But building purchase orders line by line is exactly the work that never gets done on a busy week, which is how shortages start.

What we did

Orders are sized from usage rate, lead time, and review period, grouped by whichever linked supplier prices those items lowest, and raised as a draft. Nothing leaves the building until a person sends it. Sending creates the shipment record, and marking that shipment delivered writes the restock logs, updates on-hand quantities, and closes the order.

The outcome

Reordering became a review-and-send action with a complete trail from recommendation through delivery back into stock levels.

03

One account, several locations, no crossover

The problem

A group with three restaurants needs one login and shared suppliers, but a manager at one site must never see another site's costs, and no company can ever see another company's negotiated pricing.

What we did

Company and location scoping was designed into the fifteen-table schema up front rather than bolted on afterwards. Roles are checked against an explicit permission table on every API route, and the same boundary is enforced again by Postgres row-level security, so a query that gets past the application layer still returns nothing.

The outcome

Access control holds at two independent layers, and adding a location or a teammate is a settings change rather than a data migration.

04

Billing that fails softly

The problem

A single paying-or-not flag either locks a restaurant out the minute a trial ends or leaves the gate open forever. Neither is acceptable when the software is holding the day's ordering.

What we did

Access resolves to one of three states, full, grace, or locked, computed on read from the trial end date and the subscription status, so no scheduled job has to run for it to be correct. A seven-day grace window and date-gated reminder emails sit on top.

The outcome

A company works straight through an expired card without raising a support ticket, and still locks out cleanly if nothing gets resolved.

Approach

How the work ran

  1. 01

    Discovery and Research

    The build opened with a nine-week implementation plan mapped directly onto the product's core loop, before any interface work started. The fifteen-table data model and its row-level security policies were designed up front, so tenancy and access were settled decisions rather than something to retrofit later.

  2. 02

    UI/UX Design

    Layout, color system, and page patterns were fixed early against real mockups, then applied without deviation across every later feature. KPI cards, modals, empty states, and table conventions all follow the same documented rules, which is why a page built in month four looks like one built in month one.

  3. 03

    Development and Testing

    Features shipped one at a time, each verified in a real browser against real data before the next one started. Role-scoped views were checked from both an owner account and a manager account, so the permission model was exercised the way an operator meets it and not only as a unit of code.

  4. 04

    Deployment and Support

    Production runs on Vercel with managed Postgres, auth, and a nightly scheduled function that re-runs the engine for every location and emails the results. Go-live included a dedicated hardening pass, and a move to a branded auth domain was handled afterwards as its own scoped piece of work.

Features

What shipped

Seven-rule engine, no trained models

Reorder point, suggested order quantity, stockout risk, waste pattern, usage spike, cross-location variance, and supplier-delay response. Each is a deterministic formula with centrally configurable thresholds, so an operator can be told exactly why an alert fired and nobody has to retrain anything.

Demand forecasting from real sales history

A weighted moving average runs against sales imported from the restaurant's own point-of-sale exports and returns a per-item confidence rating of high, medium, low, or still collecting, rather than one unqualified number.

Purchase orders that route themselves

An order is sized from usage rate, lead time, and review period, then split into line items grouped under whichever linked supplier prices them lowest. The operator reviews and sends.

Shipment tracking with automatic restocking

Sending an order creates its shipment record. Marking that shipment delivered writes the restock logs, updates on-hand quantities, and marks the order fulfilled, so stock levels never drift from what actually arrived.

Role-scoped access at two layers

Owner and manager roles are checked against an explicit permission table on every API route, and the same company and location boundary is enforced again in the database through row-level security.

Reports that actually export

Six report views covering trends, waste, reorder history, shipment reliability, and demand, each with working CSV and PDF export so a manager can hand a printed report to an accountant.

Results

Measured, not estimated

100 / 100

Best practices and SEO

Lighthouse scored the production build 100 for best practices and 100 for SEO on the public landing page.

94

Accessibility score

The same Lighthouse run returned 94 for accessibility, with keyboard and screen-reader paths checked across the dashboard.

Want an operations platform this precise?

Shipistry turned a manual, guess-driven process into a system that flags the problem before anyone notices it. We can build the same kind of platform around your operation. Tell us where the guesswork lives.

Have a Project To Discuss?

Contact Us