Process improvement SaaS

An expert practitioner beside every project

A bilingual Lean Six Sigma workspace covering all five DMAIC phases plus nine supporting tools. It knows which tool suits the problem in front of you, and it produces the same standard of output every time. The statistics are computed in code, so a Black Belt can check the working.

Process improvementNext.js 15SupabaseAnthropic Claude

Live at dmaicpro.ai

DMAIC Pro shown across a laptop and two browser windows
About the product

Your AI guide from process to result

Lean Six Sigma is a rigorous method that most teams run in a scatter of spreadsheets, slide decks and half-remembered training. The knowledge lives with whoever did the Black Belt course; everyone else guesses which tool fits, and the analysis quality swings wildly between projects. The brief was to put an expert practitioner beside every project, one that knows which tool suits the problem in front of you and produces the same standard of output every time.

We built a multi-tenant SaaS product on Next.js and Supabase, with an Anthropic Claude gateway that runs entirely server-side. It covers all five DMAIC phases plus nine supporting tools: a root cause advisor, a waste identifier with value stream mapping, a 21-tool selection matrix, an action tracker, an industry benchmark, a report generator, a project portfolio, industry templates and a dashboard. Everything is bilingual English and Czech, down to the transactional email, which is sent in whichever language the user last used the app in.

Two constraints shaped the engineering more than anything else. First, the model must never see the API key and must never be able to run up an unbounded bill, so every call goes through one server route that authenticates the user, rate-limits them, checks credits before spending and debits through an atomic database function afterwards. Second, statistics are computed in code, never by the model. Mean, standard deviation, quartiles, control limits, DPMO and correlation are all pure TypeScript, ported function by function from the client's original prototype with line references back to it. The AI writes the narrative; the numbers come from arithmetic.

Industry
Process improvement and operational excellence SaaS
Platform
Responsive web application: an authenticated single-page app plus a public marketing site and legal pages
Timeline
About ten weeks, June to August 2026
Team
Dezy Solutions team

What we did

  • Frontend engineering
  • Backend and API
  • Database design with row-level security
  • Third-party integrations
  • DevOps and hosting configuration
  • UI implementation

Stack

Next.js 15React 19TypeScriptSupabaseAnthropic ClaudeStripeResendVerceljsPDFSheetJS
Goals

What the build had to achieve

Expertise on tap

Make the method usable by people who have not done the training. The product recommends the right tool for the problem described, explains when to use it, and warns about the pitfall that usually derails it, rather than presenting a blank canvas and 21 options.

Numbers you can defend

An improvement project stands or falls on its baseline. Every statistic is computed in code and traceable to a formula, so a Black Belt can check the working. No figure in the Measure phase is ever generated by a language model.

Bilingual as a requirement, not a layer

Czech and English are equal throughout: interface, AI prompts, PDF exports and transactional email, which is sent in the language stored on the user's profile, so a billing email fired by a webhook days later still arrives in the right one.

A spend ceiling that actually holds

AI features are only viable if the cost is bounded. Credits are checked before each call and debited after it through an atomic database function, and the per-user rate limit is counted from the usage table rather than in memory, so it still binds across many serverless instances.

Inside the product

DMAIC Pro, screen by screen

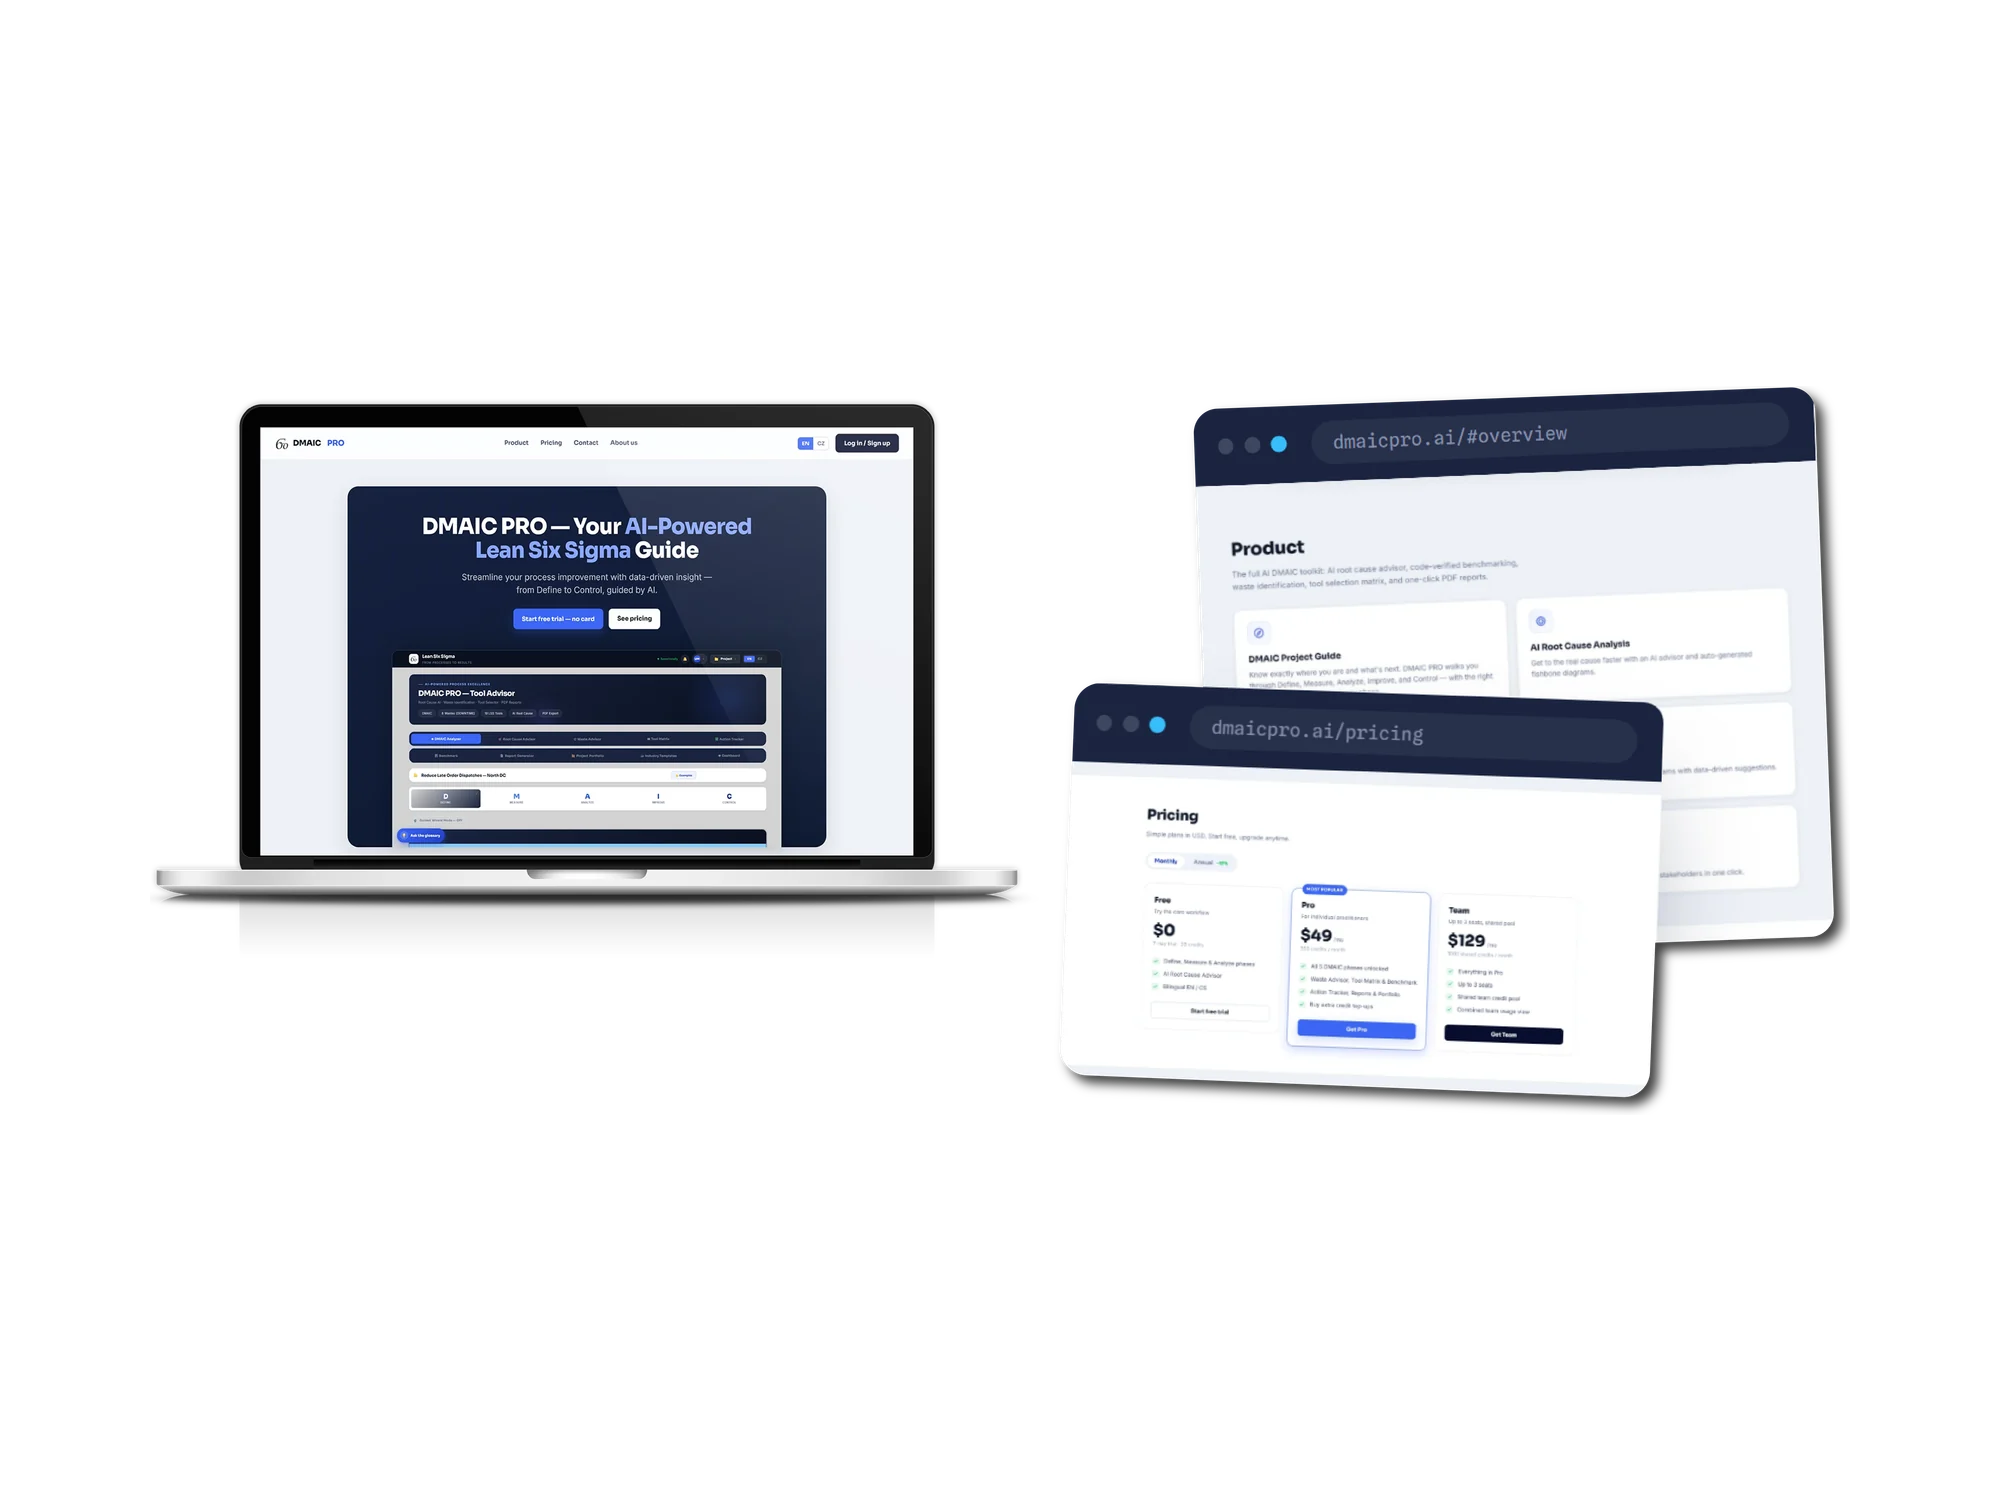
A laptop showing the DMAIC PRO marketing landing page, headed DMAIC PRO, Your AI-Powered Lean Six Sigma Guide, with EN and CZ language toggles in the navigation, buttons reading Start free trial, no card, and See pricing, and a screenshot of the application below. Two browser windows beside it show a Product section describing the AI root cause advisor, code-verified benchmarking, waste identification, tool selection matrix and one-click PDF reports, and a Pricing page with a Free plan at zero dollars, a Pro plan at 49 dollars a month marked most popular, and a Team plan at 129 dollars a month for up to three seats with a shared credit pool.
01

Bilingual from the front door

A public site fronts the app in English and Czech, showing the product itself in the hero. Every price, credit allowance and seat count on the pricing page is read from the database at request time, so it cannot drift from what Stripe actually charges.

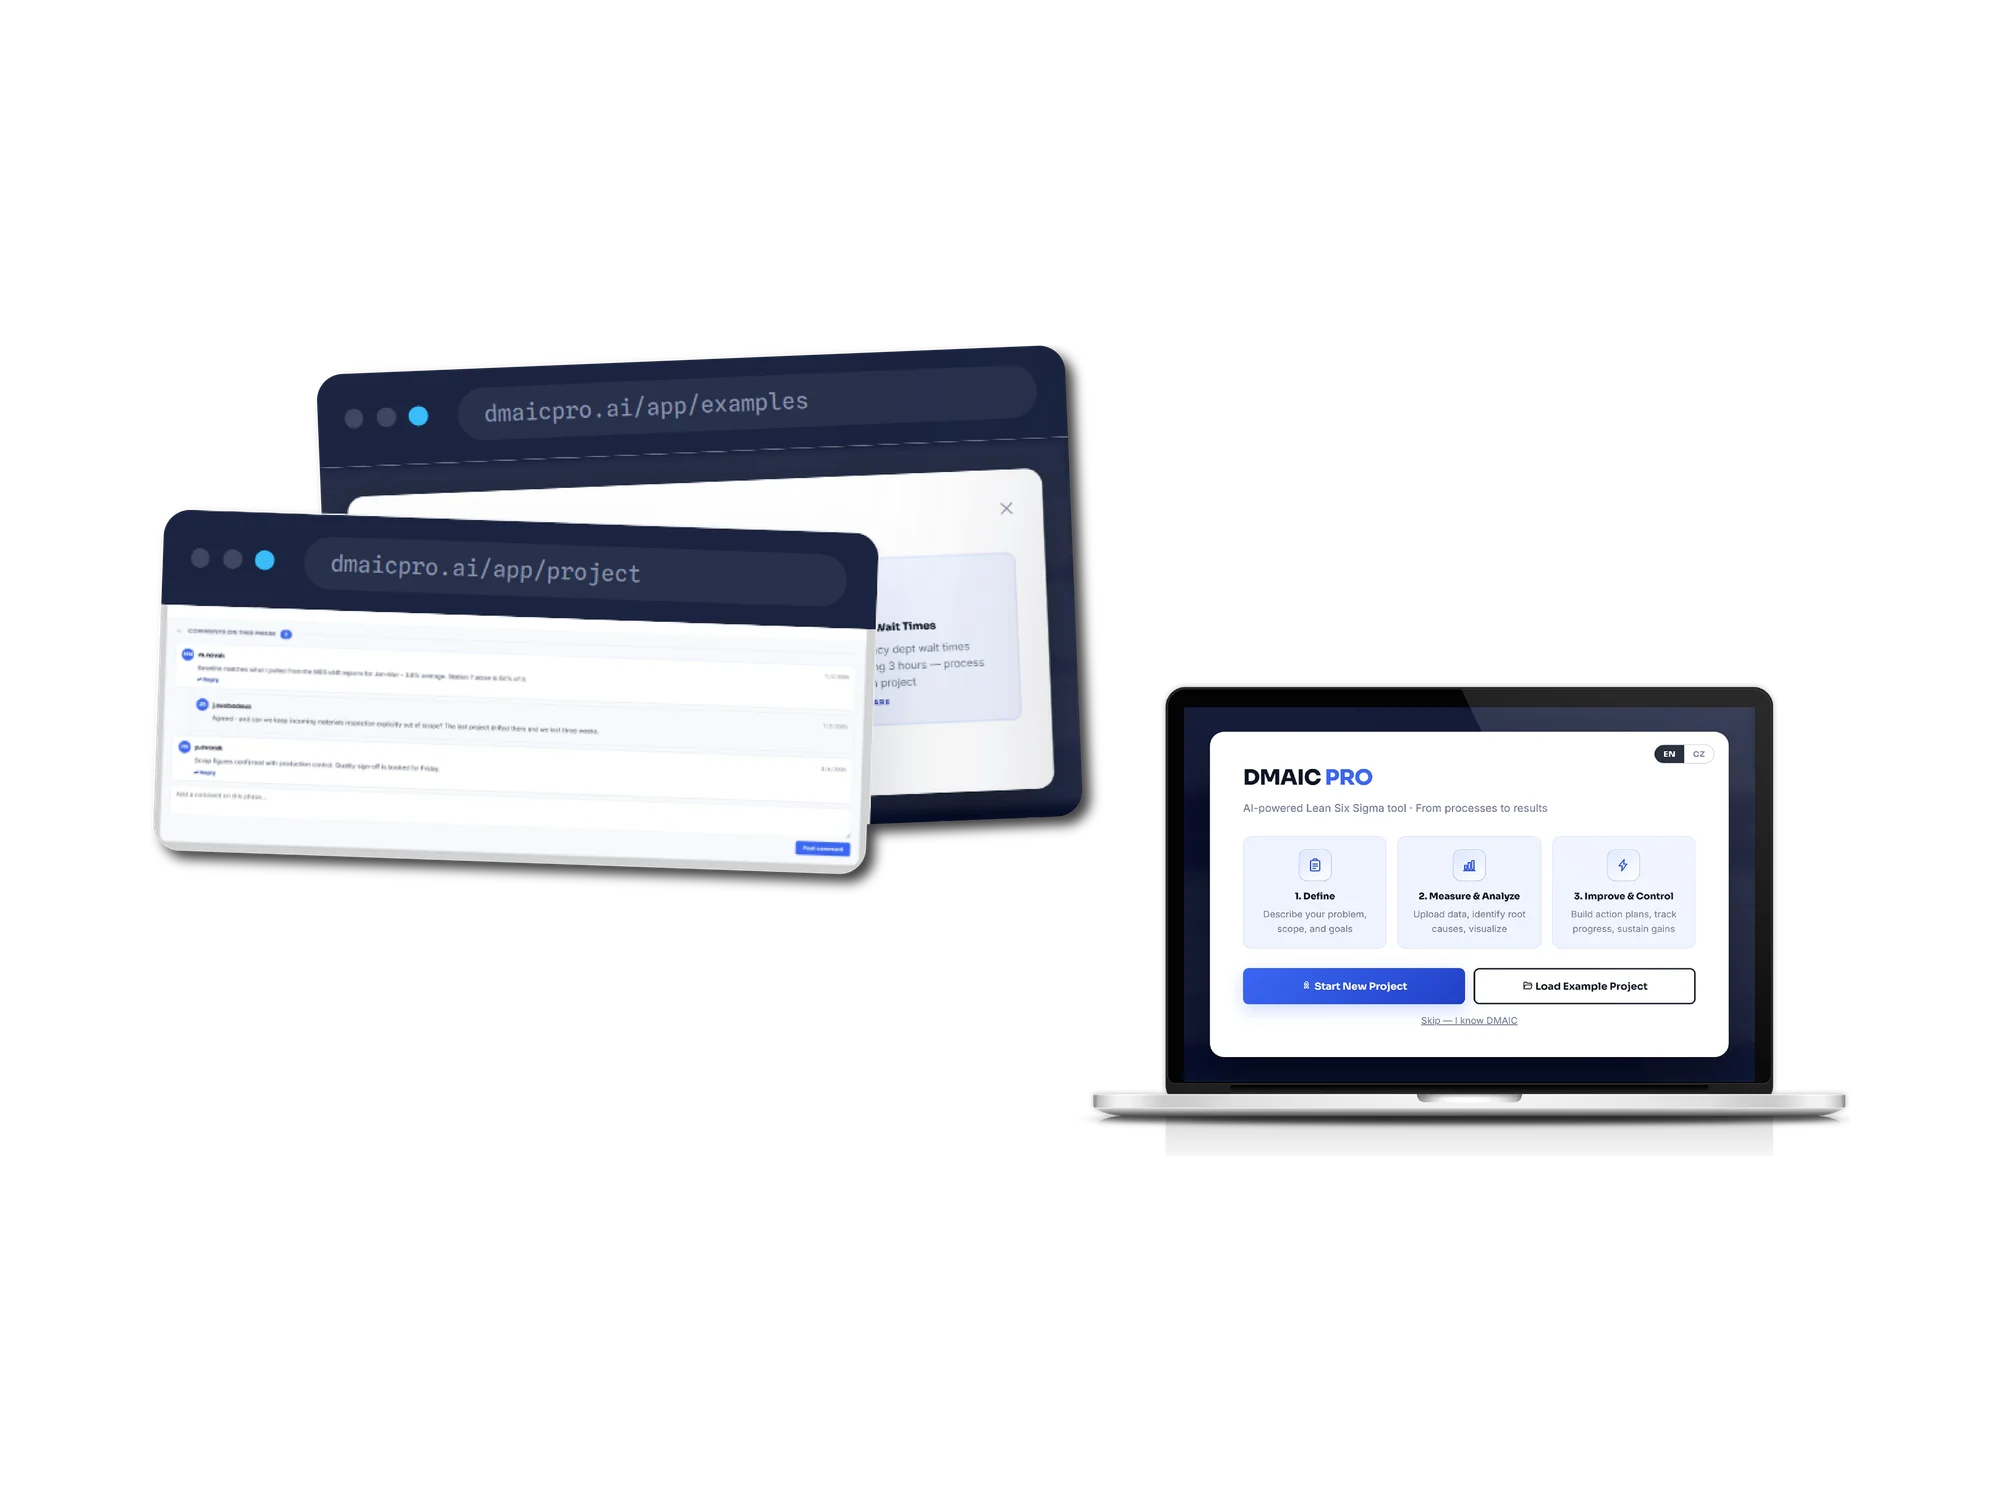
A laptop showing a DMAIC PRO first-run card with EN and CZ toggles, three numbered steps reading Define, describe your problem, scope and goals; Measure and Analyze, upload data, identify root causes, visualize; and Improve and Control, build action plans, track progress, sustain gains, above buttons for Start New Project and Load Example Project and a skip link. Two browser windows behind it show an example-projects picker and a threaded comment stream on a project phase, where team members discuss baseline figures and scope.
02

Learn the method before risking your own data

New users pick a blank project, a worked example, or skip straight in. Three fully populated example projects let a first-timer see a complete DMAIC before committing anything real, and comments are threaded per phase so the review happens against the work rather than in email.

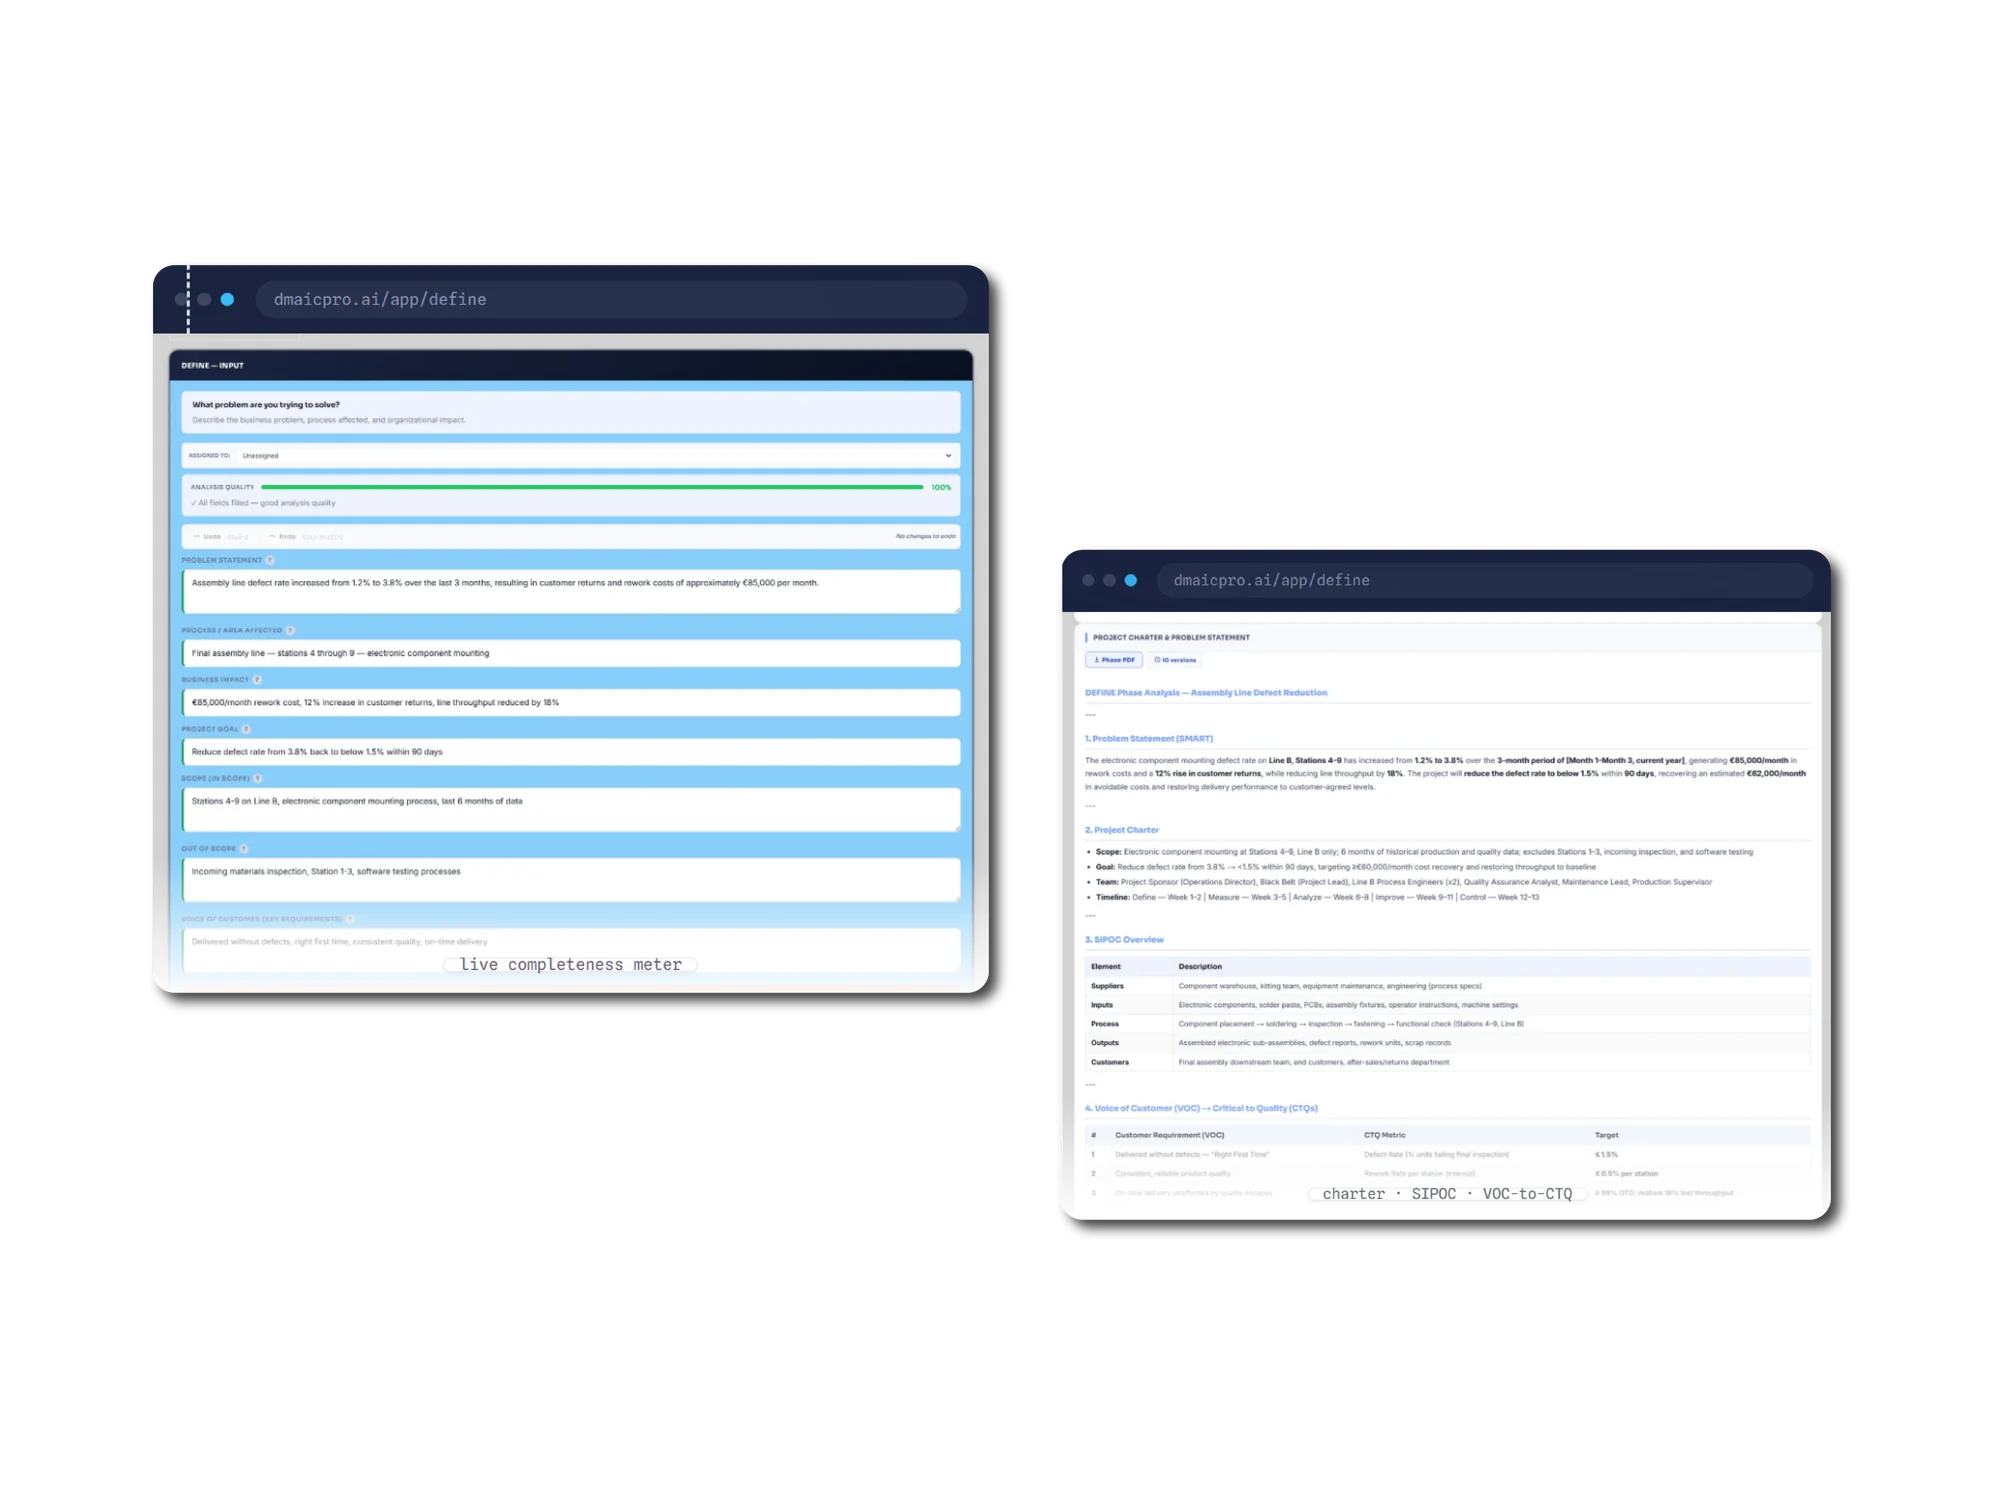
A browser window showing the DMAIC PRO Define input form with an analysis quality meter reading 100 percent and all fields filled, above fields for problem statement, process area affected, business impact, project goal, scope, out of scope and voice of customer. A second window shows the generated output: a SMART problem statement, a project charter listing scope, goal, team and a week-by-week timeline, a SIPOC overview table of suppliers, inputs, process, outputs and customers, and a voice-of-customer to critical-to-quality table with target values, above a Phase PDF export button and a version count.
03

Score the brief before spending a credit

The Define form carries a live completeness meter that rates the brief before any AI credit is spent on it. One click then turns it into a SMART problem statement, a project charter, a SIPOC table and a voice-of-customer to critical-to-quality mapping.

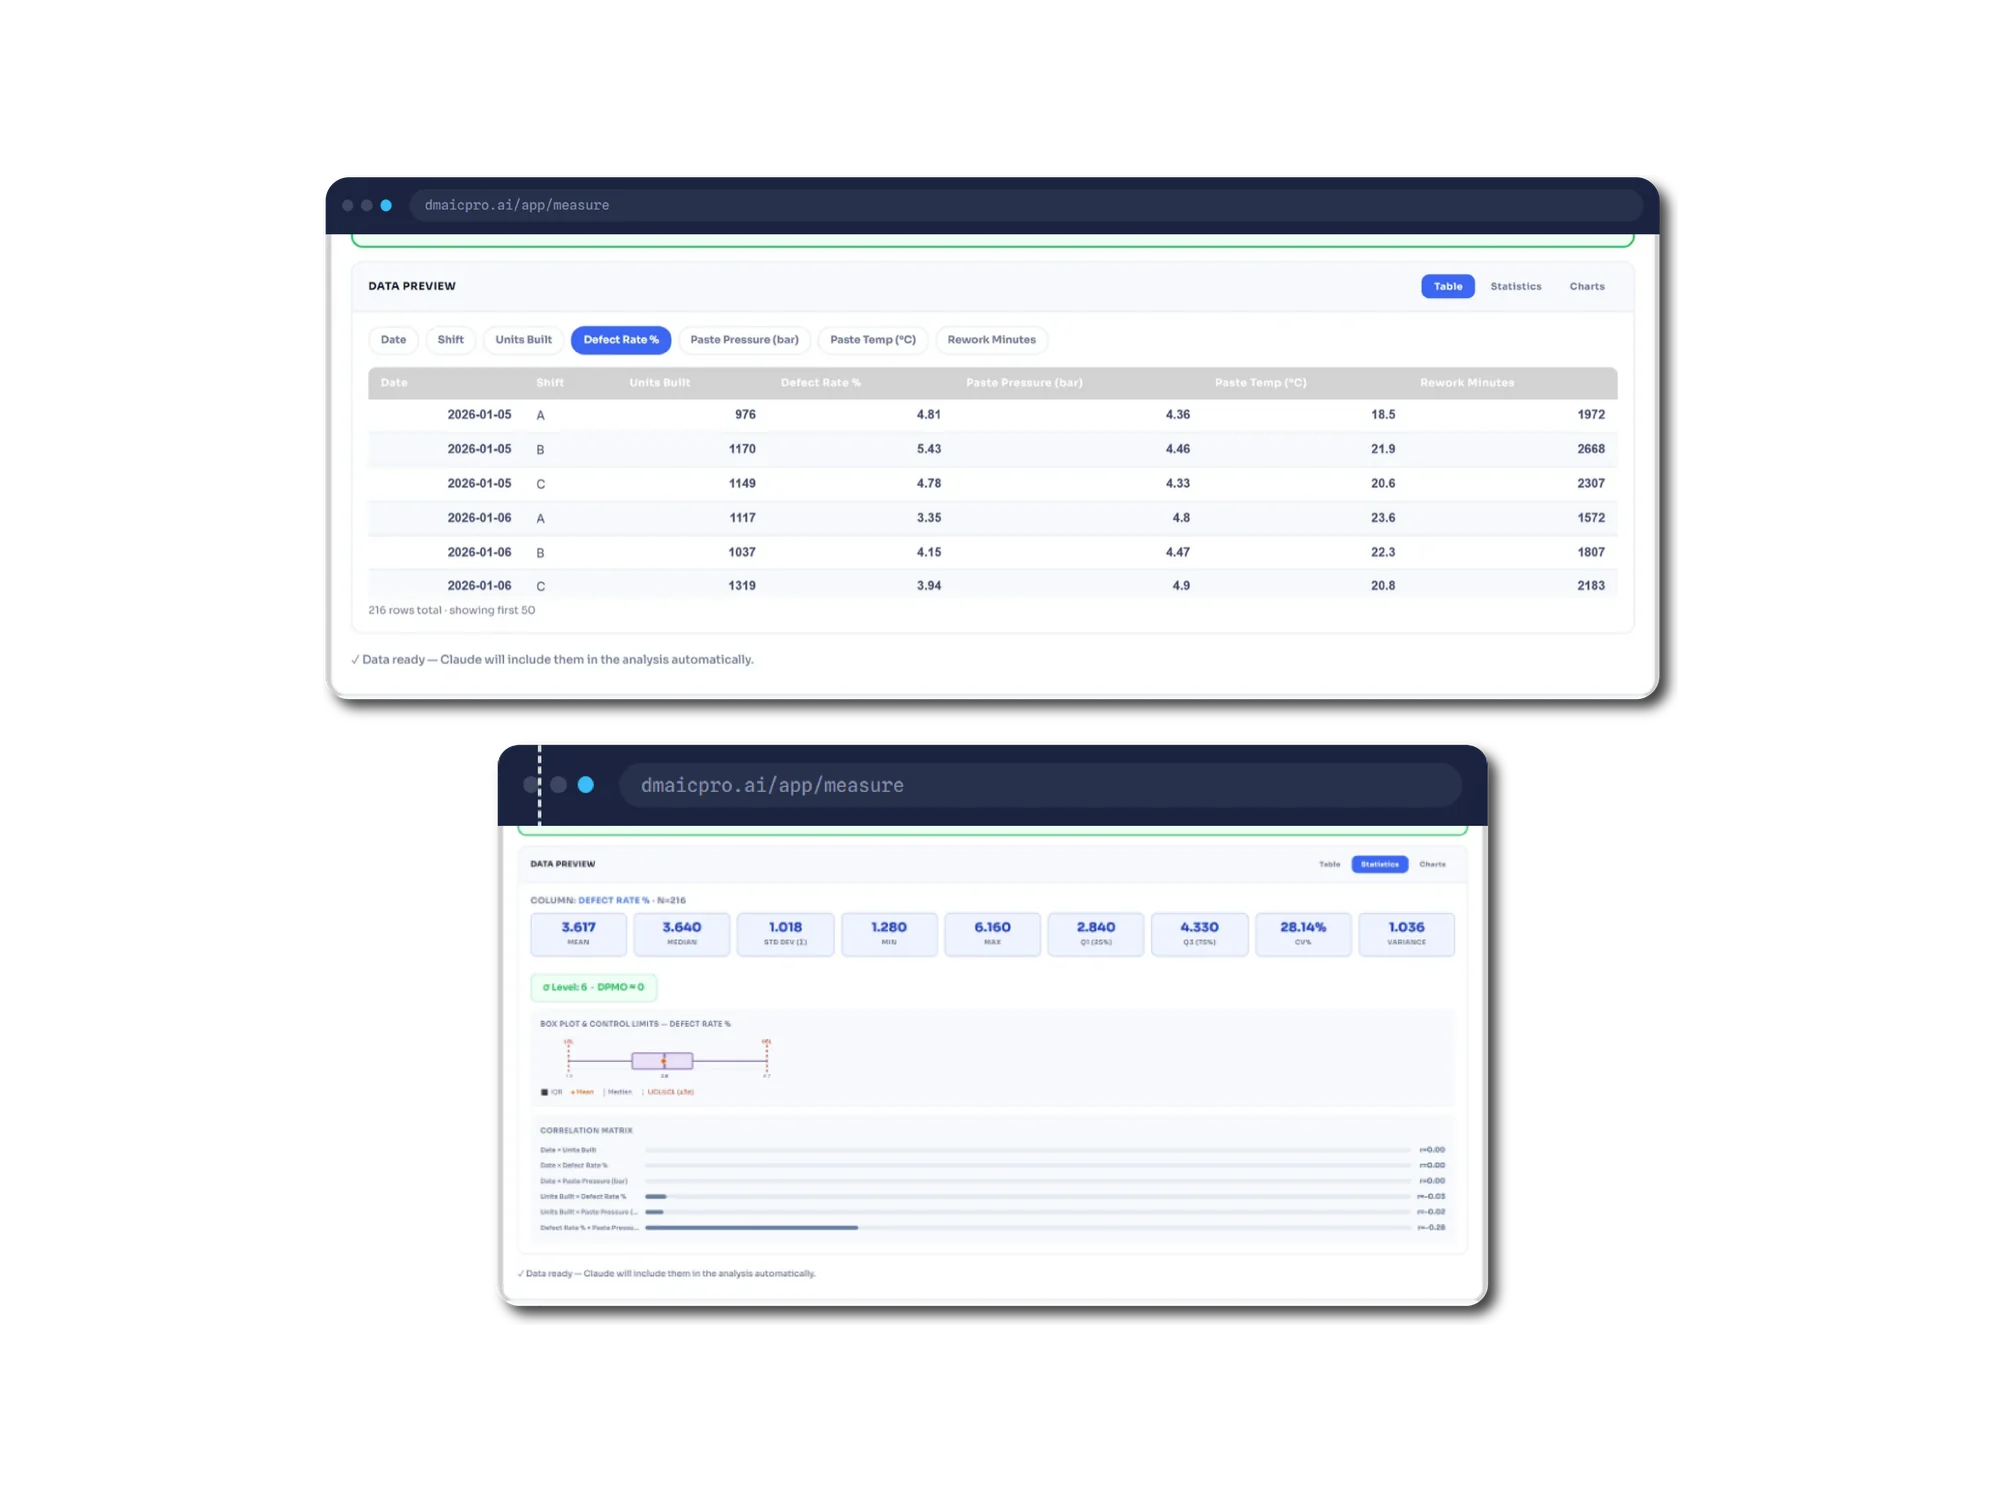
Two browser windows on the DMAIC PRO measure screen. The first shows a data preview table with columns for date, shift, units built, defect rate, paste pressure, paste temperature and rework minutes, noting 216 rows total showing the first 50, and a line reading data ready, Claude will include them in the analysis automatically. The second shows the statistics view for the defect rate column across 216 values: mean 3.617, median 3.640, standard deviation 1.018, minimum 1.280, maximum 6.160, first quartile 2.840, third quartile 4.330, coefficient of variation 28.14 percent and variance 1.036, above a sigma level badge, a box plot with control limits, and a correlation matrix.
04

The maths is arithmetic, not a language model

Drop in an Excel or CSV export and columns are detected instantly. Mean, spread, quartiles, control limits, DPMO and the correlation matrix are all pure TypeScript, ported function by function from the client's prototype with line references back to it. No figure here is ever generated by the model.

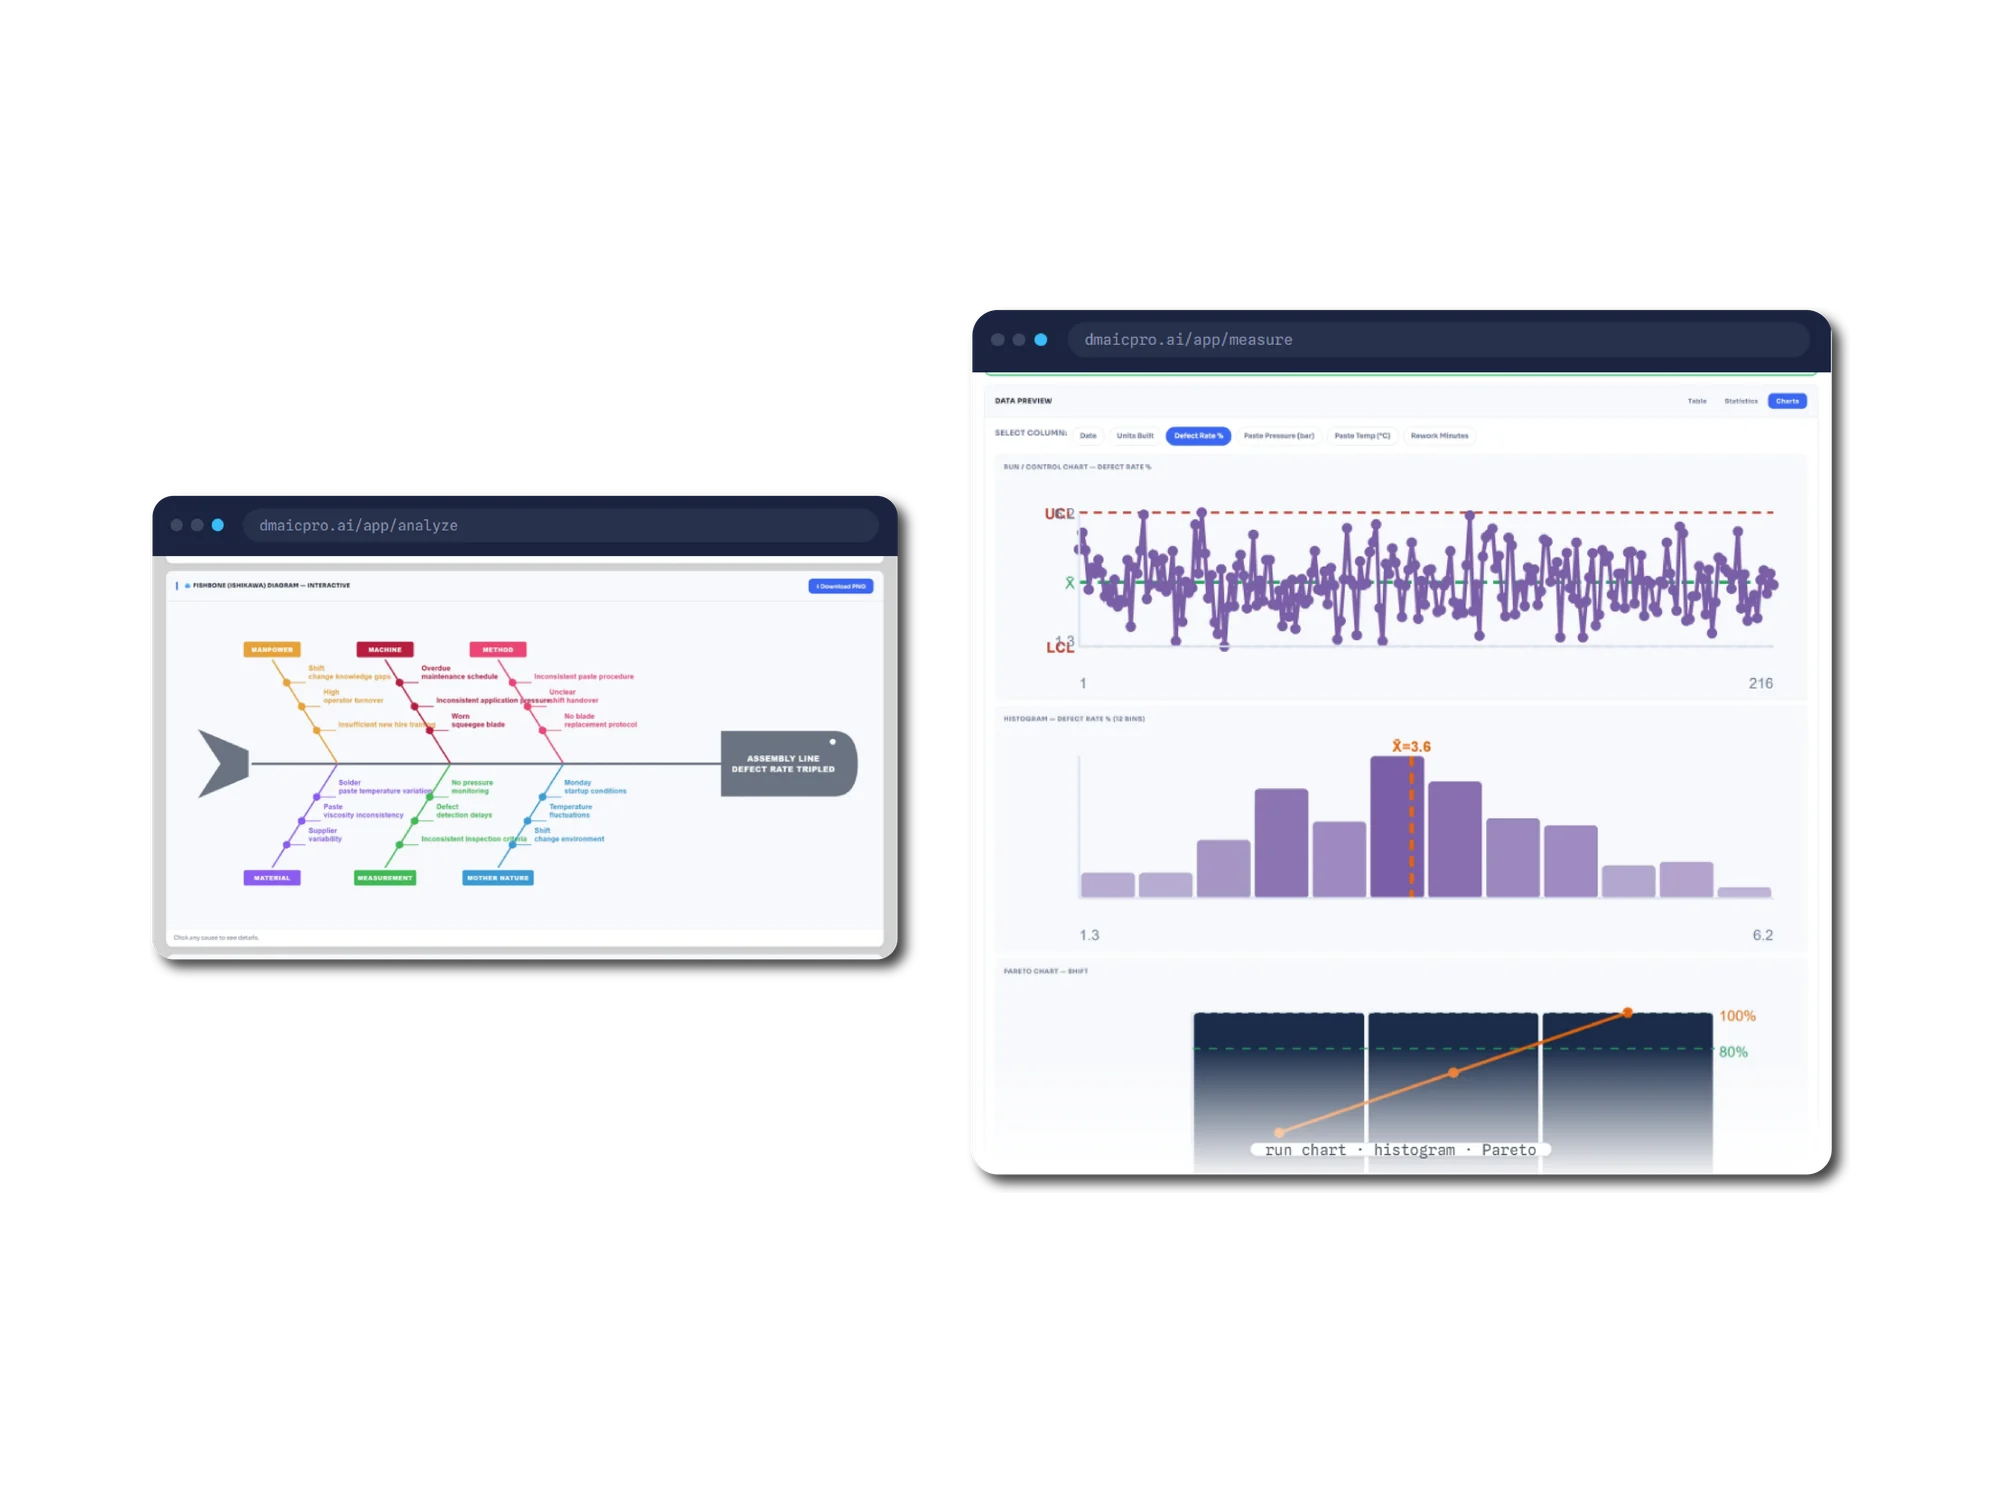
Two browser windows. The first shows an interactive fishbone or Ishikawa diagram with six labelled bone categories, Manpower, Machine, Method, Material, Measurement and Mother Nature, each carrying specific causes such as shift change knowledge gaps, overdue maintenance schedule, inconsistent paste procedure and solder paste temperature variation, all converging on an effect labelled assembly line defect rate tripled. The second shows the charts view with a run and control chart across 216 points with upper and lower control limits and a centre line, a twelve-bin histogram with the mean marked, and a Pareto chart with a cumulative line crossing the eighty percent threshold.
05

Charts drawn by hand, causes drawn from the data

Run chart, histogram and Pareto are hand-built SVG with no charting library in the bundle. The Analyze phase turns the symptoms into a six-category Ishikawa diagram whose causes come from the project's own data rather than a generic template.

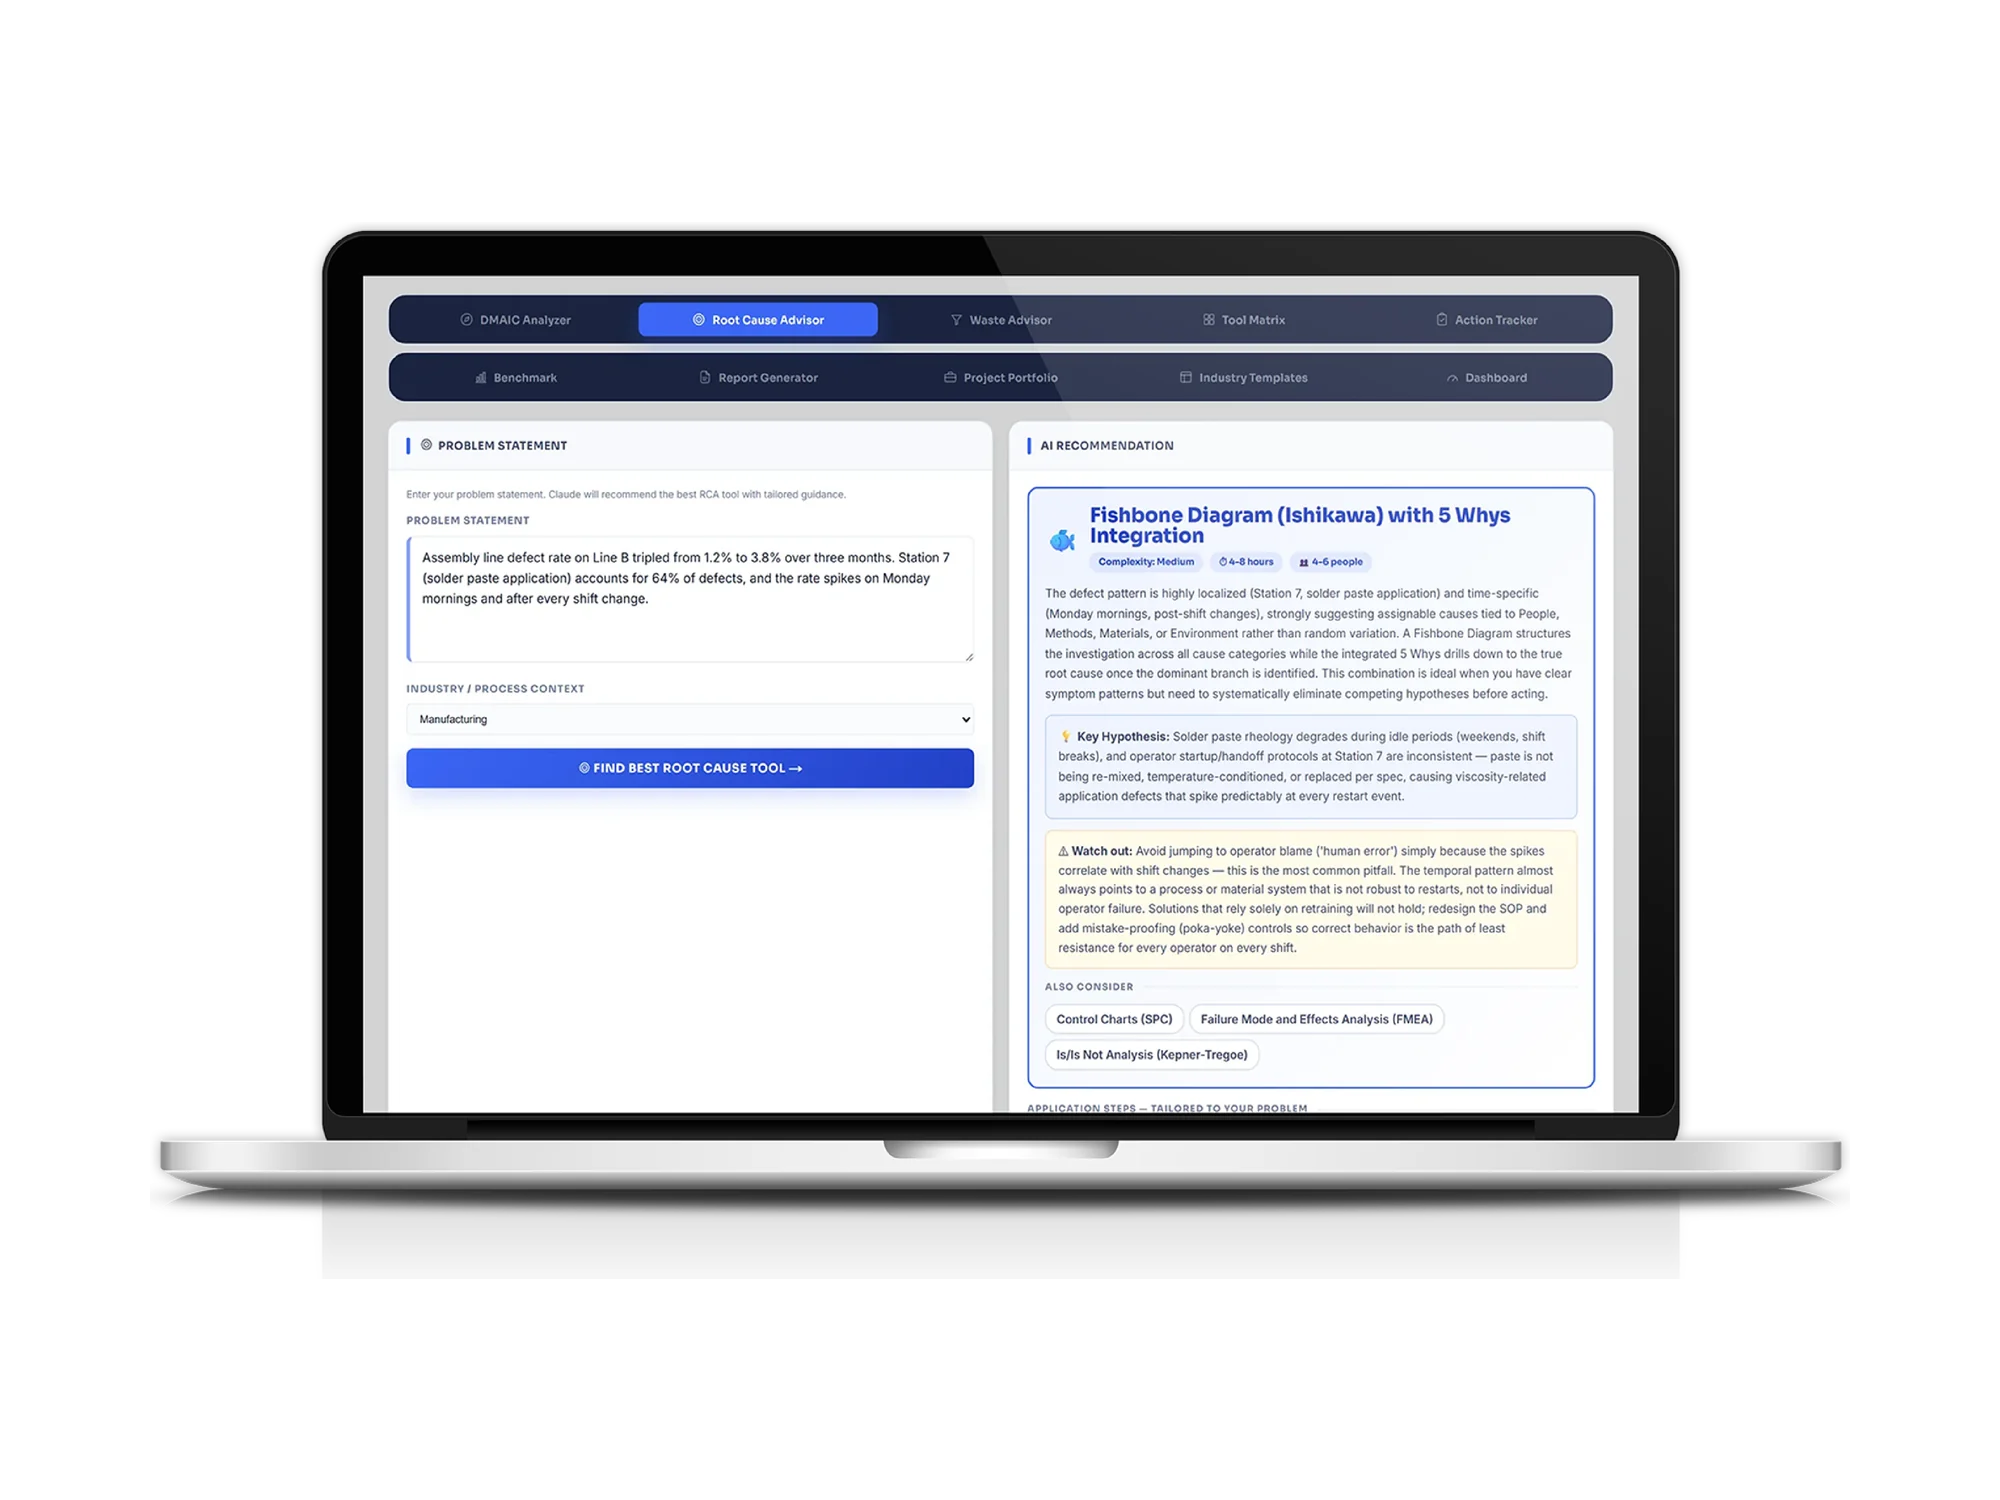
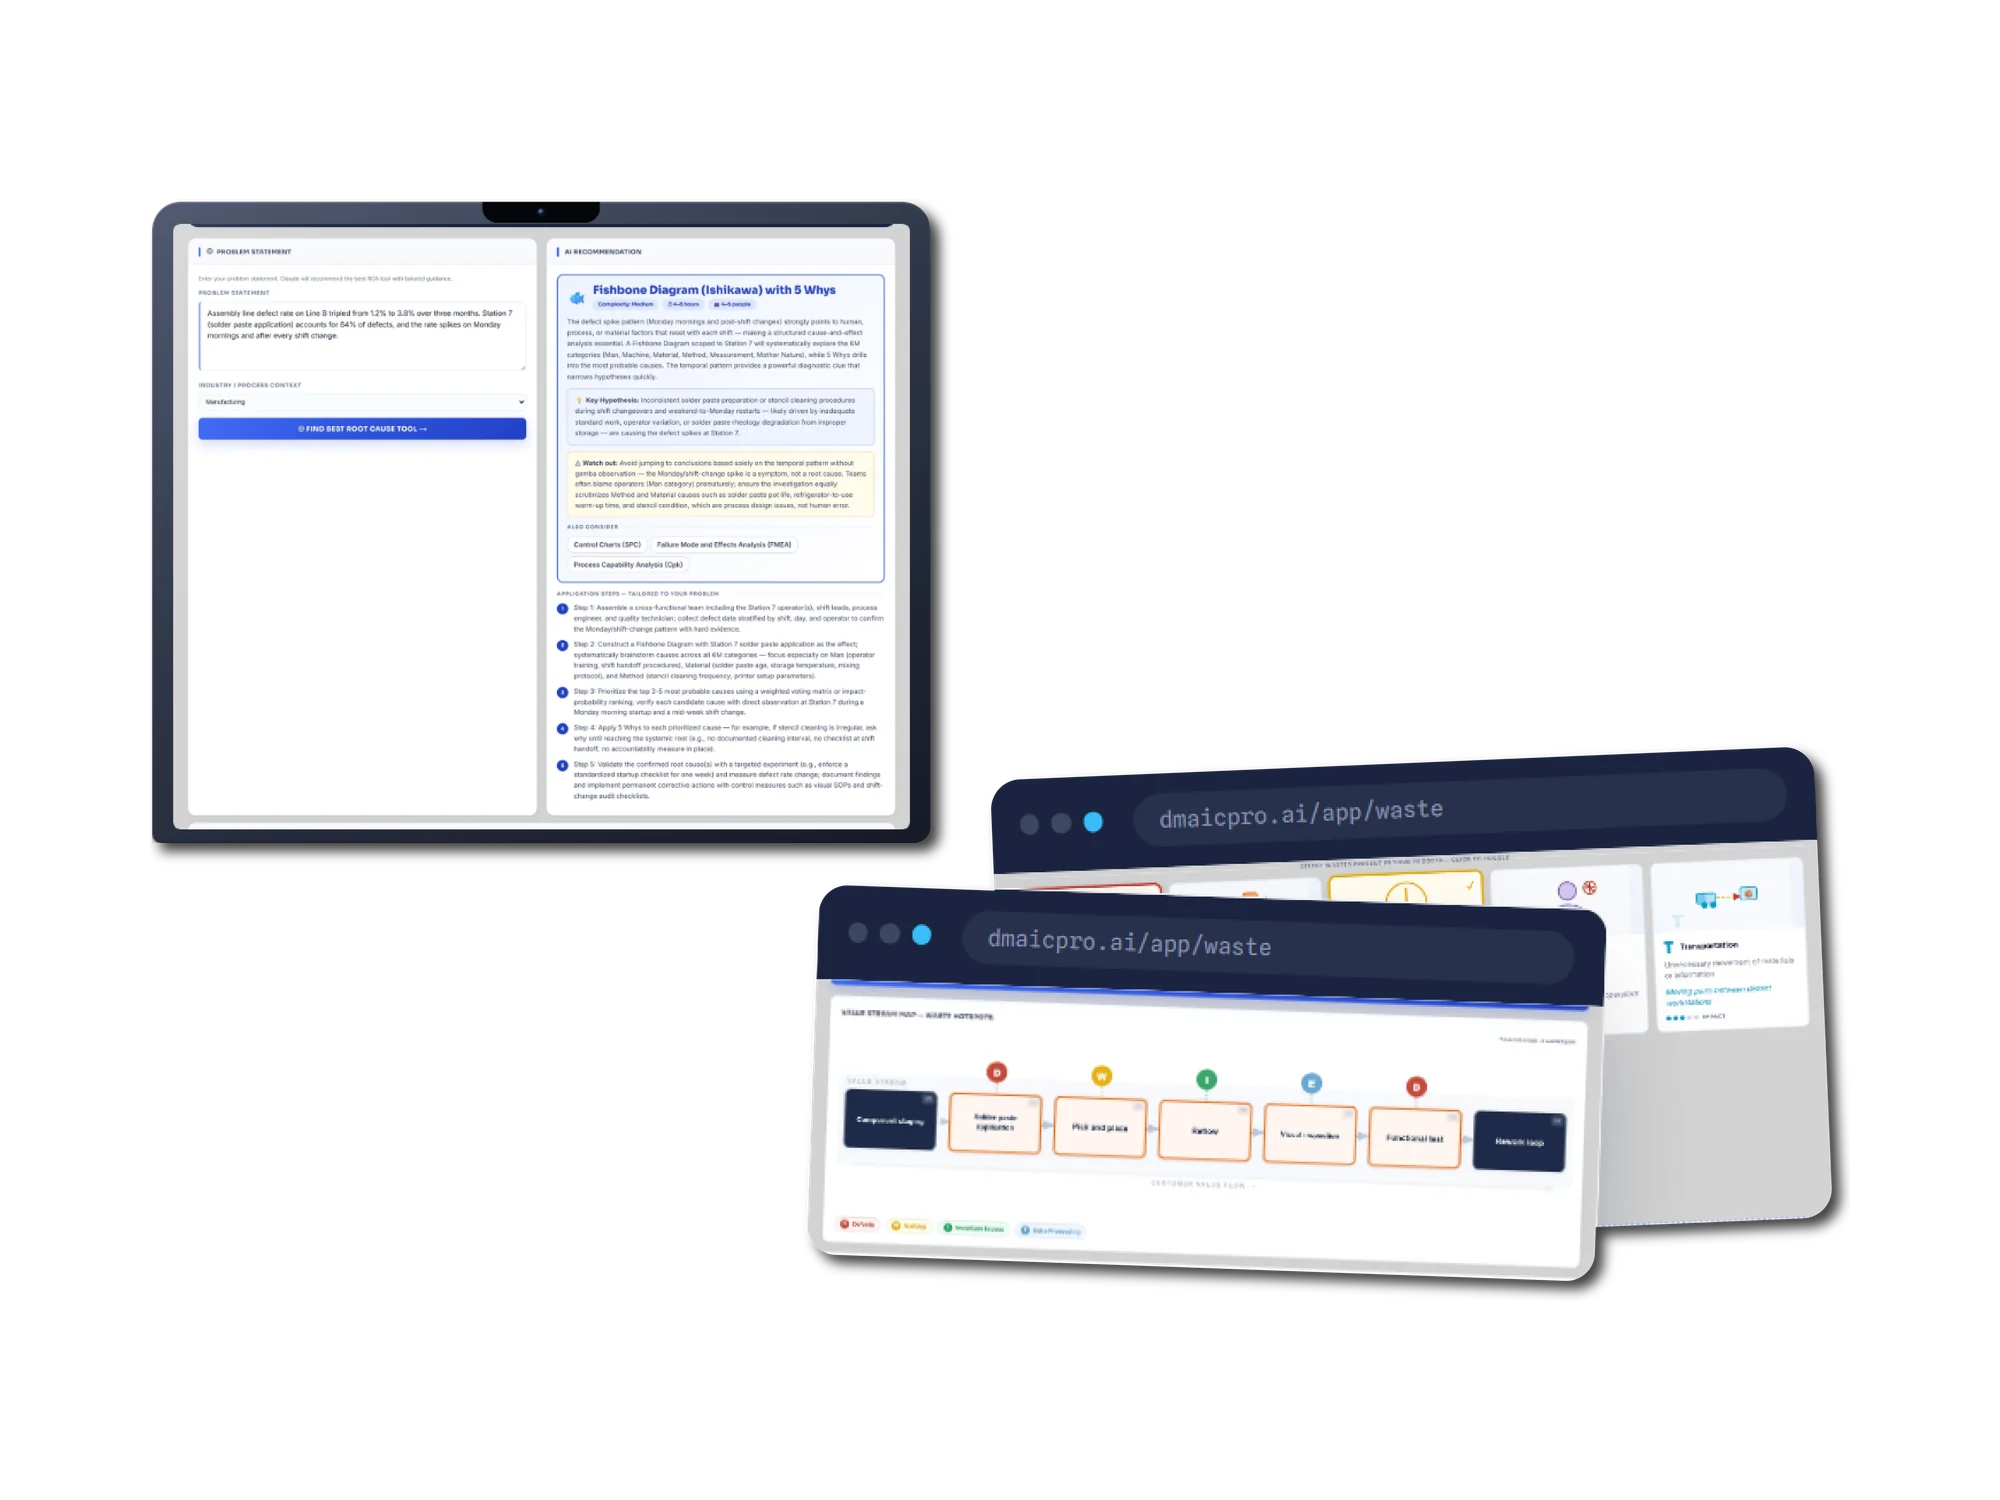
A tablet showing the root cause advisor with a problem statement about an assembly line defect rate and an AI recommendation of a Fishbone Diagram with 5 Whys integration, giving complexity, estimated hours, team size, a key hypothesis, a watch-out about blaming operators, alternative tools to consider, and five application steps tailored to the problem. Two browser windows beside it show the eight wastes as illustrated cards including transportation with an impact rating, and a value stream map where process steps from component staging through solder paste application, pick and place, reflow, visual inspection and functional test to a rework loop each carry pinned waste markers.
06

Find the waste, then pin it to the step

The eight DOWNTIME wastes as toggleable cards with an impact rating and an example drawn from the selected industry. The process steps you type become a value stream with the selected wastes pinned to the exact step where they occur.

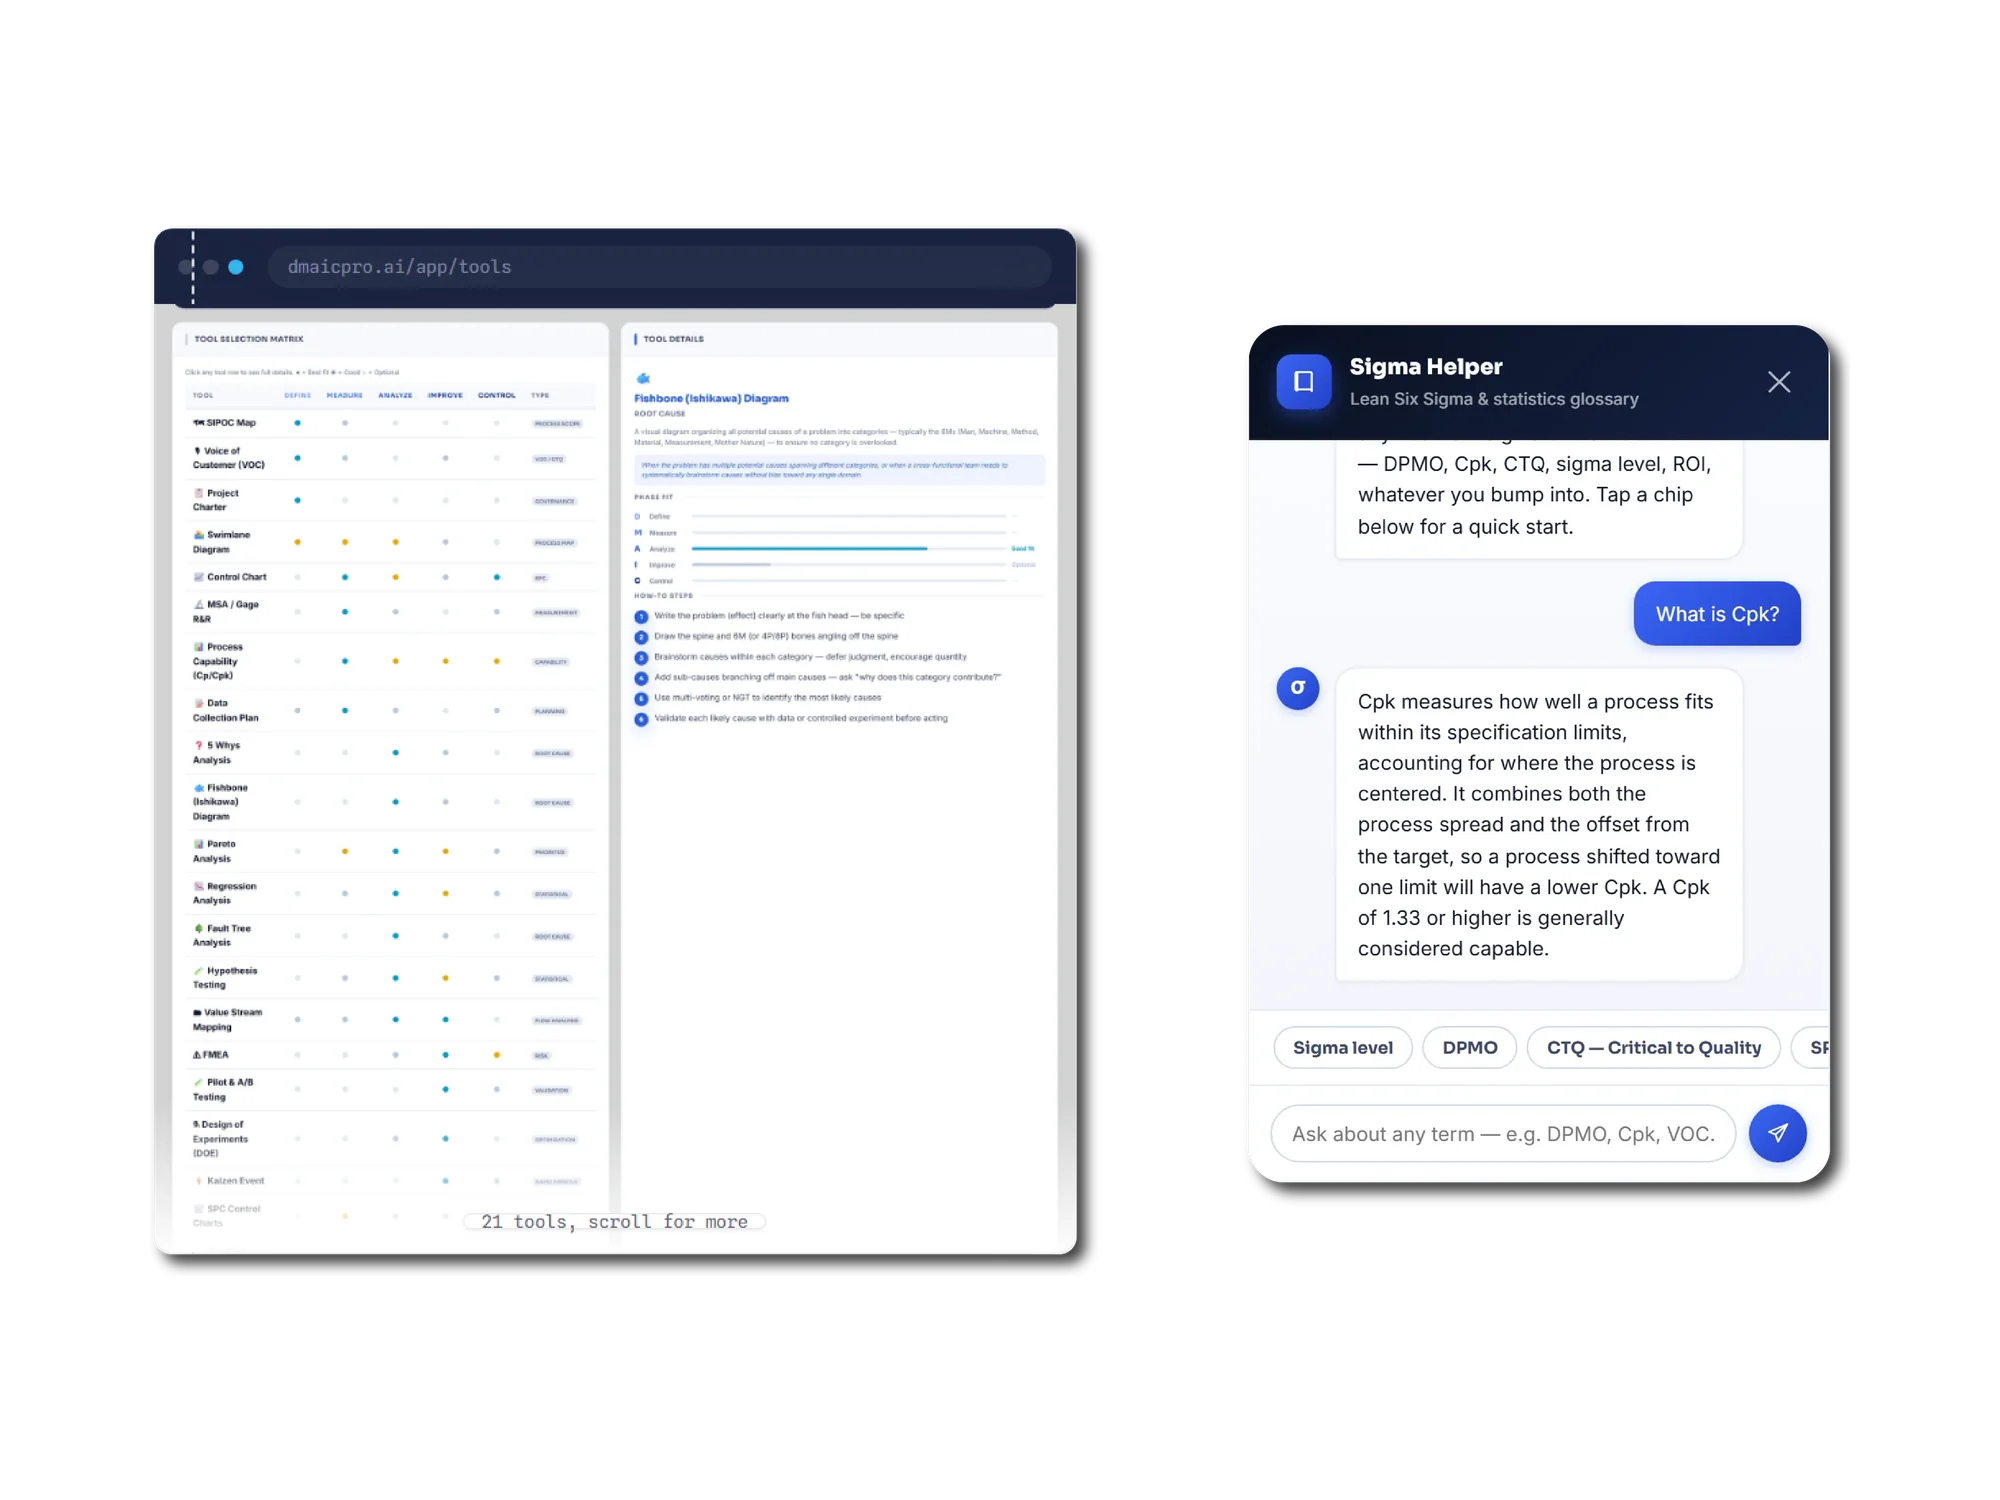
A browser window showing a tool selection matrix listing twenty-one Lean Six Sigma tools including SIPOC Map, Voice of Customer, Project Charter, Control Chart, Process Capability, 5 Whys, Fishbone, Pareto, Regression, FMEA, Value Stream Mapping and Design of Experiments, each scored for fit across the Define, Measure, Analyze, Improve and Control columns, with a detail panel explaining the Fishbone diagram, its phase fit and six how-to steps. Beside it a Sigma Helper chat panel answers the question what is Cpk with a plain-English explanation of process capability and the 1.33 threshold, above suggestion chips for sigma level, DPMO and critical to quality.
07

Which tool, and why

Twenty-one Lean Six Sigma tools scored for fit against all five DMAIC phases, each with the theory and the how-to steps. A glossary assistant answers terminology questions in place, so nobody has to leave the workflow to look up Cpk.

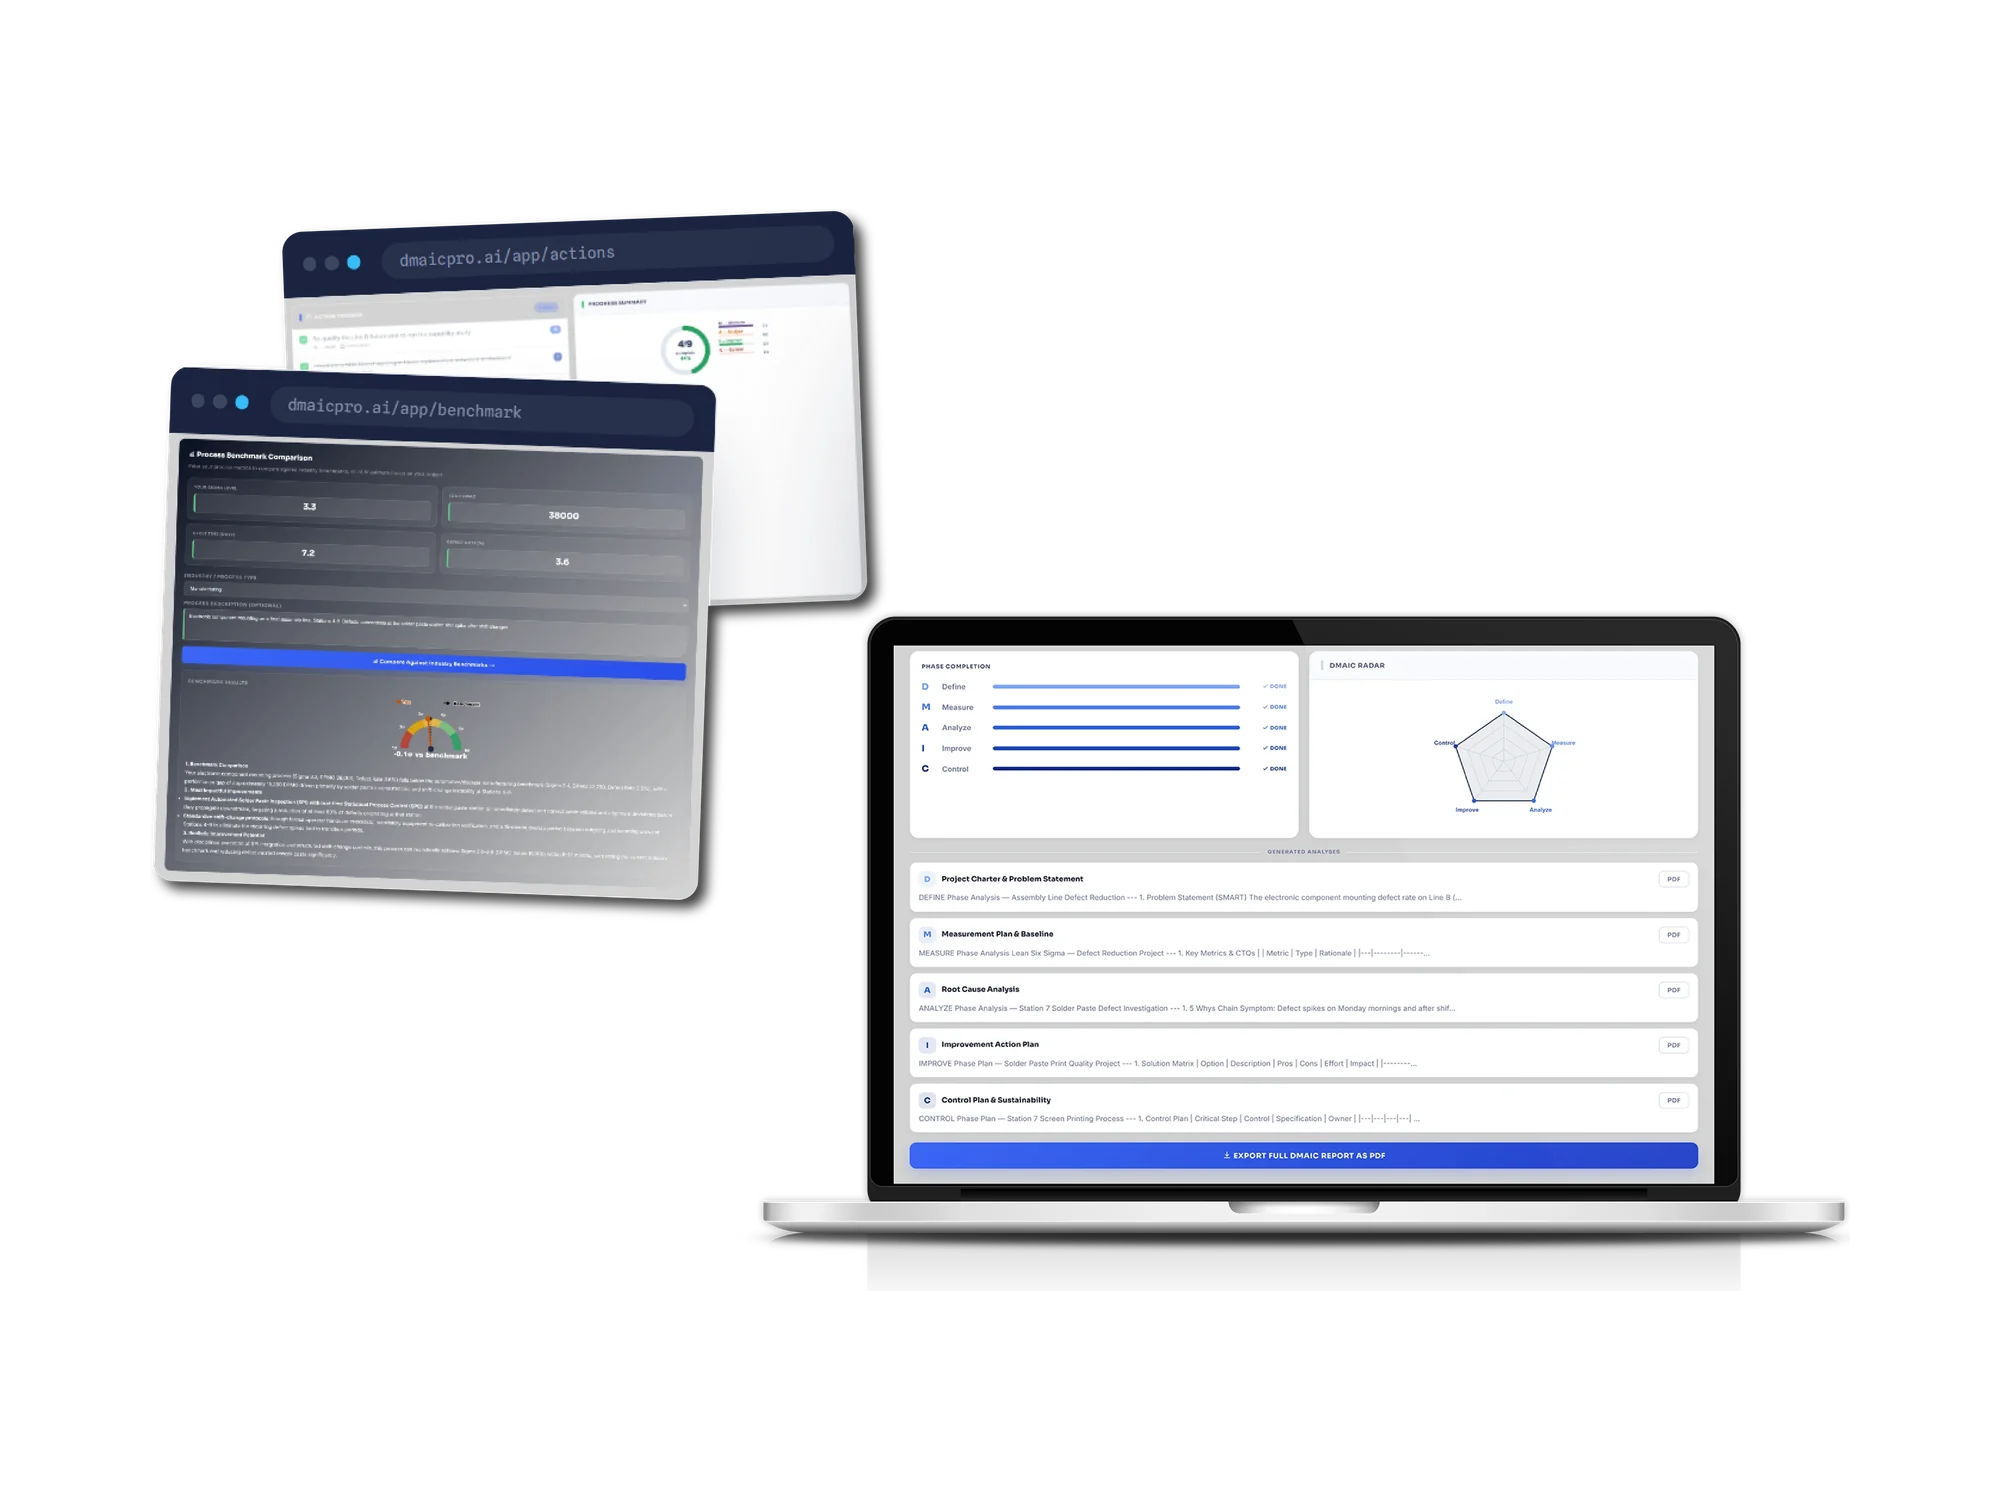
Two browser windows and a laptop. The first window shows an action tracker with owners and a progress ring reading four of nine complete, broken down by DMAIC phase. The second shows a process benchmark comparison taking a sigma level, DPMO, cycle time and defect rate, with an industry selector and a gauge showing the gap against the benchmark plus a written read on where the gap actually is. The laptop shows a project dashboard with all five DMAIC phases marked done, a five-axis DMAIC radar chart, and a list of generated analyses covering the project charter, measurement plan, root cause analysis, improvement action plan and control plan, each with its own PDF button above an export full report button.
08

Track the actions, benchmark the gap

Actions carry an owner, a due date and the phase they belong to, with completion rolled up per phase. The dashboard shows phase completion, a DMAIC radar and every generated analysis, each exportable on its own or as one full report.

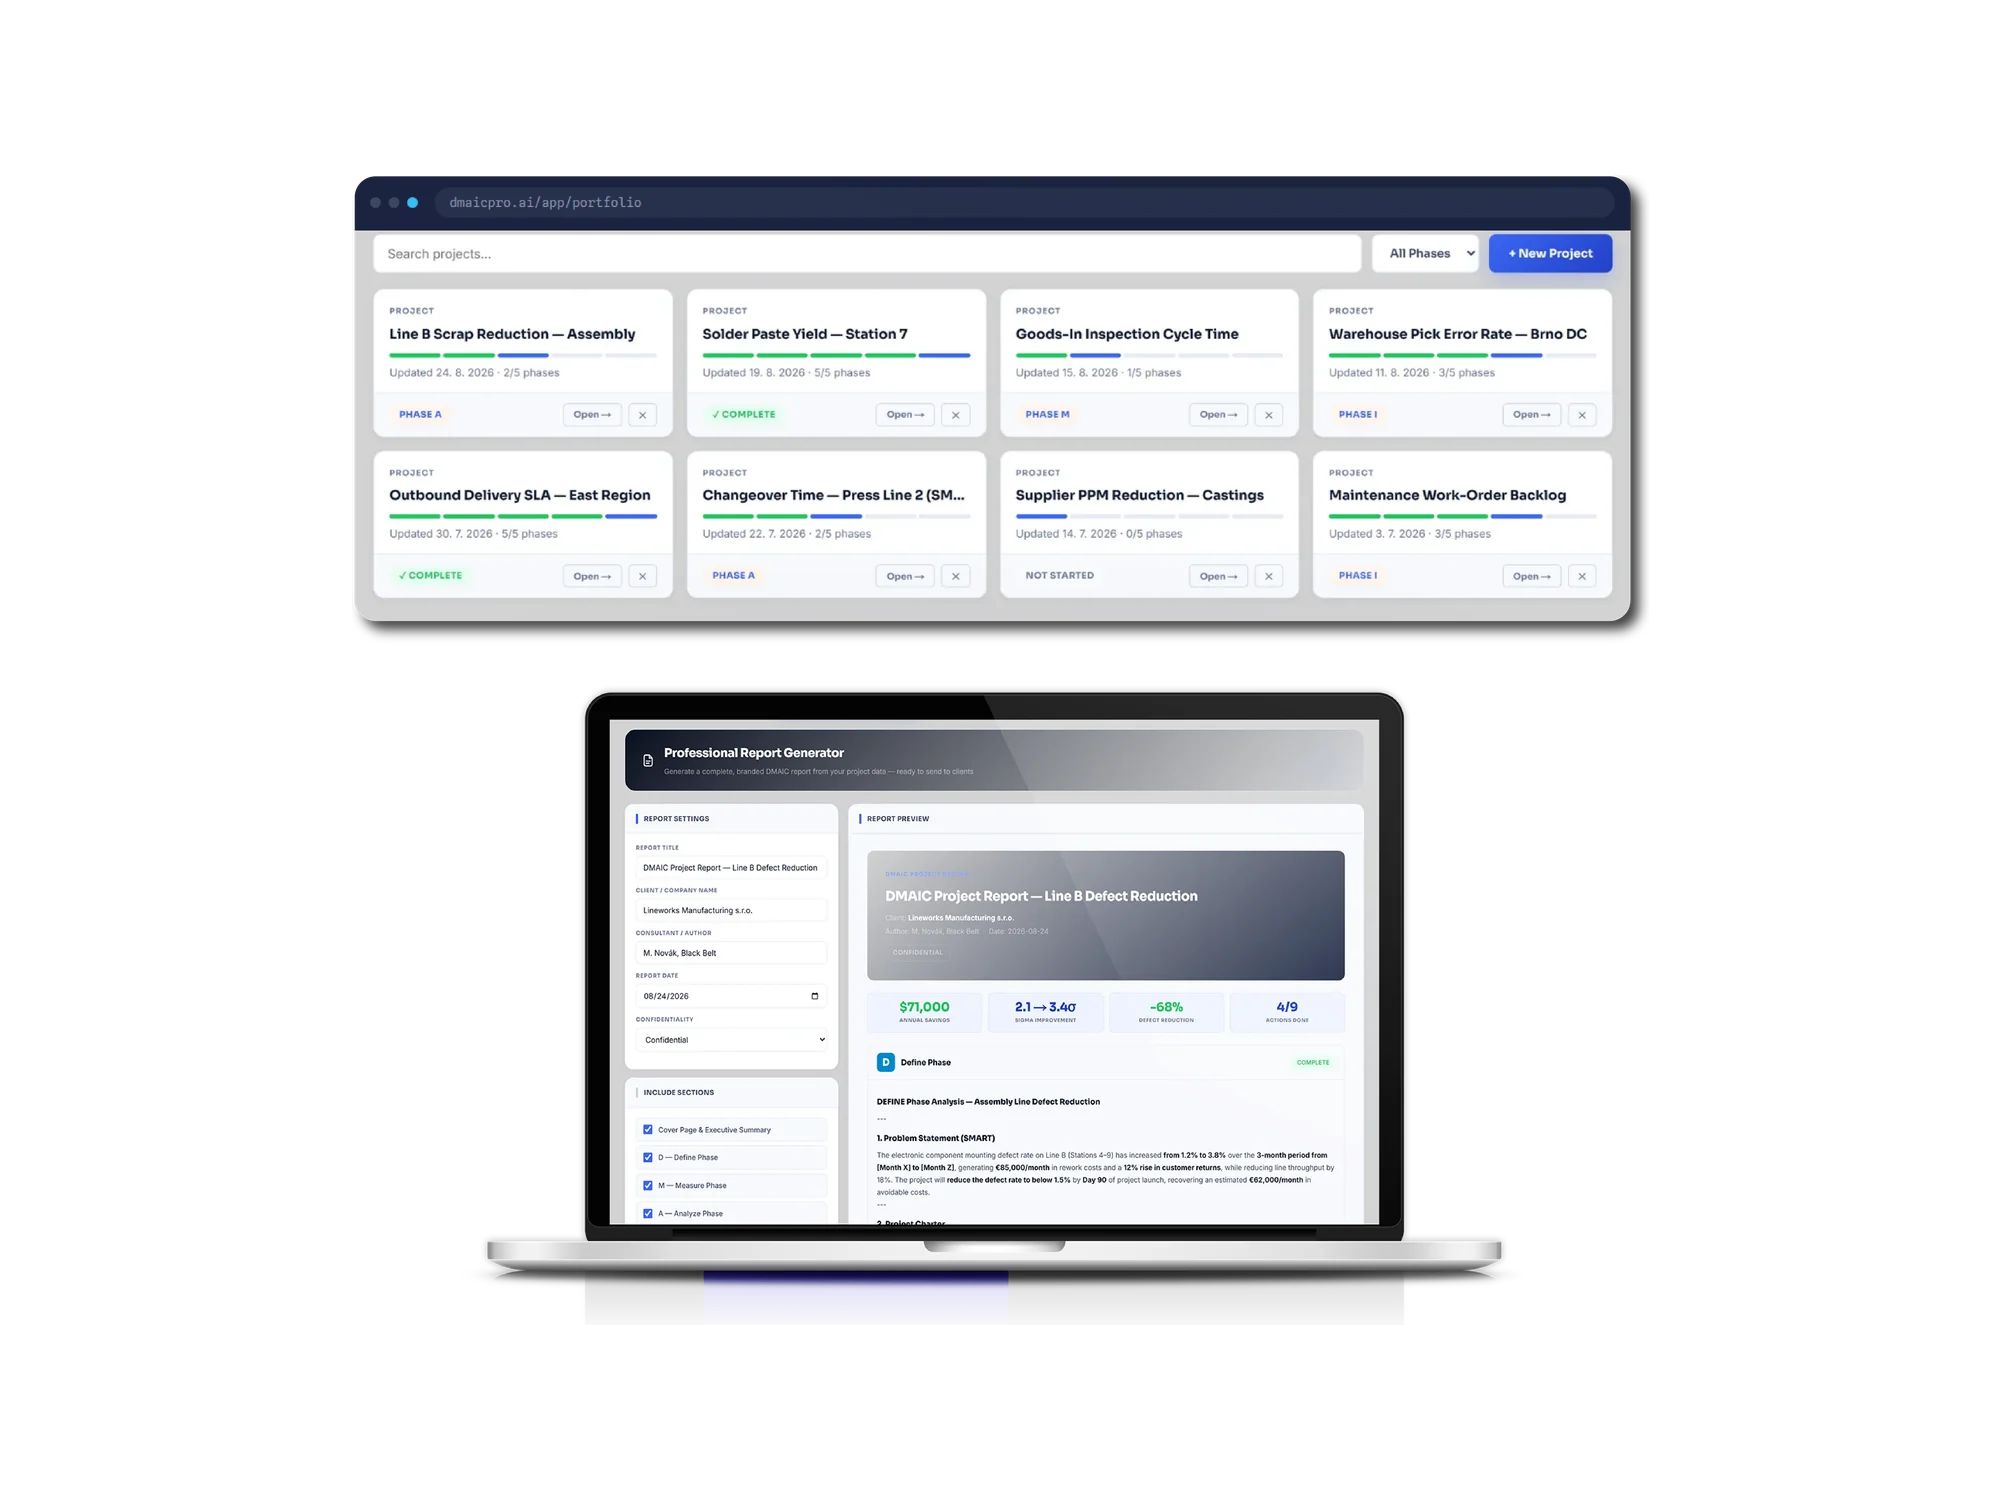
A browser window showing a project portfolio of eight improvement projects, each with a name, a five-segment phase progress bar, a last-updated date and a status such as Phase A, Phase M, Phase I, Not Started or Complete, above search and phase filter controls. A laptop below shows a professional report generator with settings for report title, client name, consultant, date and confidentiality on the left, and a live preview on the right showing a branded cover block, a row of summary tiles, and the Define phase section with a SMART problem statement, all populated from the application's seeded example project.
09

The report the client actually reads

Every project in the workspace with its phase and progress, and a report builder that assembles a branded, section-by-section DMAIC report ready to export as a PDF and send. The figures shown are the product's own seeded example data.

Challenges

The parts that were genuinely hard

01

Giving away unlimited AI without giving away the business

The problem

Some accounts had to be permanently free, the client's own and everyone on a partner domain, but free meant unmetered access to a paid model API. The obvious implementation, writing a plan and a large credit balance onto the account, was the wrong one: the Stripe webhook, the team-sync trigger and the nightly trial-expiry job all write to those same columns, and any of them could silently revoke the exemption.

What we did

We made comp status derived, never stored. It is resolved at read time from the verified session email against an exemptions table, and nothing in the feature ever writes to the plan or credit columns, so no existing write path can undo it. Domain matching is exact equality rather than a suffix test, because a suffix check would have matched an attacker-registered lookalike domain and handed it unlimited model spend. The lookup fails closed: any database error grants nothing.

The outcome

A nineteen-commit feature ending with the matcher covered by sixteen unit tests, including the revoked-row path. It also surfaced a live billing trap, where a comped user who also held a real subscription lost their cancel button and could be charged with no way to stop it, fixed in the same series.

02

A rate limit that survives serverless

The problem

The AI gateway needed a per-user ceiling. The normal approach, an in-memory counter, is useless on a serverless platform where each function instance has its own memory and a burst of requests lands across several of them, so the limit resets under exactly the load it exists to control.

What we did

We counted the limit from the usage table instead, ten successful calls per rolling sixty seconds, measured with a query against shared state rather than process memory. Credits are checked before the upstream call so a user can be refused without spending anything, and debited after success through an atomic Postgres function that decrements under a sufficient-balance guard and raises an error when the guarded update matches no row.

The outcome

A spend ceiling that binds across every instance, and a credit ledger that cannot be driven negative by two concurrent requests. The rare lost race is handled explicitly rather than ignored: the model call already happened, so the user still gets their text and the usage is still logged.

03

A payment provider change that silently stopped renewals

The problem

Recent Stripe API versions removed the top-level subscription field from the invoice object and moved it deeper into the payload. The invoice-paid handler read the old location, found nothing and returned early, so renewals were never provisioned and the receipt and welcome emails never went out. Nothing errored. Paying customers just quietly stopped being upgraded.

What we did

We wrote a version-tolerant resolver that reads the subscription id from either location and returns nothing only for genuinely non-subscription invoices such as one-off credit top-ups.

The outcome

Renewals provision again, and the webhook is now resilient to that class of API drift rather than to one specific payload shape.

04

Transactional email that was lying to customers

The problem

The billing emails had two faults that both damage trust: a payment-failed notice that fired when nothing had failed, and a triple-send where one event produced three identical messages.

What we did

We fixed both, added a database-level guard against duplicate welcome sends, and expanded the set to ten transactional emails covering the trial lifecycle, billing events and credit exhaustion. Language is resolved from the locale stored on the user's profile rather than from request context, so an email fired by a webhook hours after the user left still arrives in their language. Credit warnings fire only on the downward crossing of the threshold, so a user near the limit is not emailed on every subsequent call.

The outcome

Ten bilingual templates that degrade gracefully to a no-op when the mail provider is unconfigured, so a missing key in a preview environment cannot crash a checkout.

05

Porting an 11,300-line prototype without losing it

The problem

The client arrived with a finished single-file prototype that worked and that they liked. The risk in any rewrite is that behaviour quietly changes and the client's confidence goes with it.

What we did

We ported it into 104 TypeScript modules while keeping the original stylesheet as global CSS rather than re-implementing the design in a utility framework, so the visual result is the same by construction. Every ported statistical function carries a line reference back to the prototype it came from, and the file forbids improving the formulas. Behavioural bugs found during the port were fixed and annotated at the call site rather than silently changed.

The outcome

Roughly 25,900 lines across 104 files, with the design preserved and the maths verifiable against the original line by line.

06

Team sharing without opening the data up

The problem

Projects, comments, actions, versions and assignments all had to be visible to a whole workspace but invisible across tenants. The natural way to express that in Postgres row-level security is a policy that queries the membership table, which is itself protected by a policy, which recurses.

What we did

We put the membership check in a security-definer function so the policy can call it without re-entering row-level security, then applied one predicate consistently across every application table: you may see a row if you own it, or if it belongs to a team you are an active member of. The events table the payment webhook writes to has no policy at all, so only the service role can touch it.

The outcome

Thirteen tables with row-level security enabled on every one, across fifteen migrations, sharing a single auditable visibility rule.

Approach

How the work ran

  1. 01

    Discovery and research

    The engagement started from a written specification and a working prototype, with the specification treated as authoritative on any conflict. Before building, the milestone structure was fixed, accounts and database, then the AI gateway, then billing and compliance, then the public funnel, so each layer could be verified before the next depended on it.

  2. 02

    UI implementation

    The prototype's visual design was preserved deliberately rather than reinterpreted: its stylesheet was carried over as global CSS so the ported application matches what the client had already signed off. Later passes replaced emoji with a hand-built inline SVG icon set and made the layout responsive.

  3. 03

    Development and testing

    Larger features were specified before they were built, with three design documents and an implementation plan in the repository, and the billing-exemption work running design to plan to implementation to hardening across nineteen commits. Testing is deliberately targeted: sixteen unit tests cover the one pure function where a mistake would grant unlimited model spend, and two written click-through guides let a non-developer verify auth, persistence, isolation and gateway behaviour by hand.

  4. 04

    Deployment and support

    The application deploys to Vercel with a daily cron running the trial lifecycle, and Stripe drives plan state through a signature-verified, idempotent webhook that de-duplicates on the event id. A written go-live checklist covers the domain cutover: auth URLs, email templates, and the provider keys that must be switched from test to live.

Features

What shipped

Guided DMAIC workspace

All five phases in one place, each with its own prompts, completeness scoring, per-phase PDF export and version history. A guided wizard mode walks newer users through the questions rather than presenting a blank form.

AI advisors that return structure, not prose

Eight AI-assisted features, root cause, waste, fishbone, data collection, voice of customer, benchmark, phase analysis and the glossary assistant, all funnel through a single client function so transport, auth and metering exist in exactly one place. The root cause advisor returns parsed JSON: recommended tool, complexity, effort, team size, hypothesis, alternatives, pitfalls and tailored steps.

Statistics computed in code

CSV and Excel ingest with quote-aware parsing and numeric column detection, then mean, variance, standard deviation, median, quartiles, coefficient of variation, DPMO and Pearson correlation, plus run and control charts, histograms, Pareto charts and box plots drawn as hand-built SVG with no charting library.

Shared team workspaces

Invite teammates by email, share a project portfolio, comment per phase in threads, assign phases to people, and draw AI credits from a shared team pool rather than individual balances.

Metered billing with self-service

Checkout for monthly and annual Pro and Team plans plus credit top-ups, a billing portal for self-service management, a seven-day free trial that needs no card, and phase-level feature gating decided by the server and mirrored on the client for the lock UI.

Bilingual throughout, including compliance

English and Czech across the interface, AI prompts, PDF output and ten transactional emails, with GDPR data export and account deletion endpoints and themed terms and privacy pages.

Results

Measured, not estimated

0 secrets

Across 46 client chunks

We scanned every JavaScript chunk in the production client bundle for the model API key prefix and host, the database service-role key, the payment secret and webhook-signing prefixes, and the mail provider's key pattern. Zero matches, with a control check in the same run confirming the scan works.

344 kB

First Load JS on the main route

For an application carrying five DMAIC phases, ten tool tabs, hand-built charting, PDF export and spreadsheet parsing. Achieved with no CSS framework, no charting library, no icon library, no i18n library and no state-management library in the dependency tree.

13 tables

Row-level security on every one

Across fifteen migrations, sharing a single auditable visibility rule: you may see a row if you own it, or if it belongs to a team you are an active member of. The payment events table has no policy at all, so only the service role can reach it.

Turn your process data into decisions

We build AI products where the maths is verifiable, the spend is bounded, and the security boundary is on the server, not in the browser.

Have a Project To Discuss?

Contact Us