Equestrian SaaS

One platform for every horse

A web platform that gives horse owners, trainers, and stable managers one place to track health, training, spending, and risk, instead of splitting it across notebooks and spreadsheets.

Equestrian SaaSNext.jsNestJSPredictive alerts

Live at equinova.io

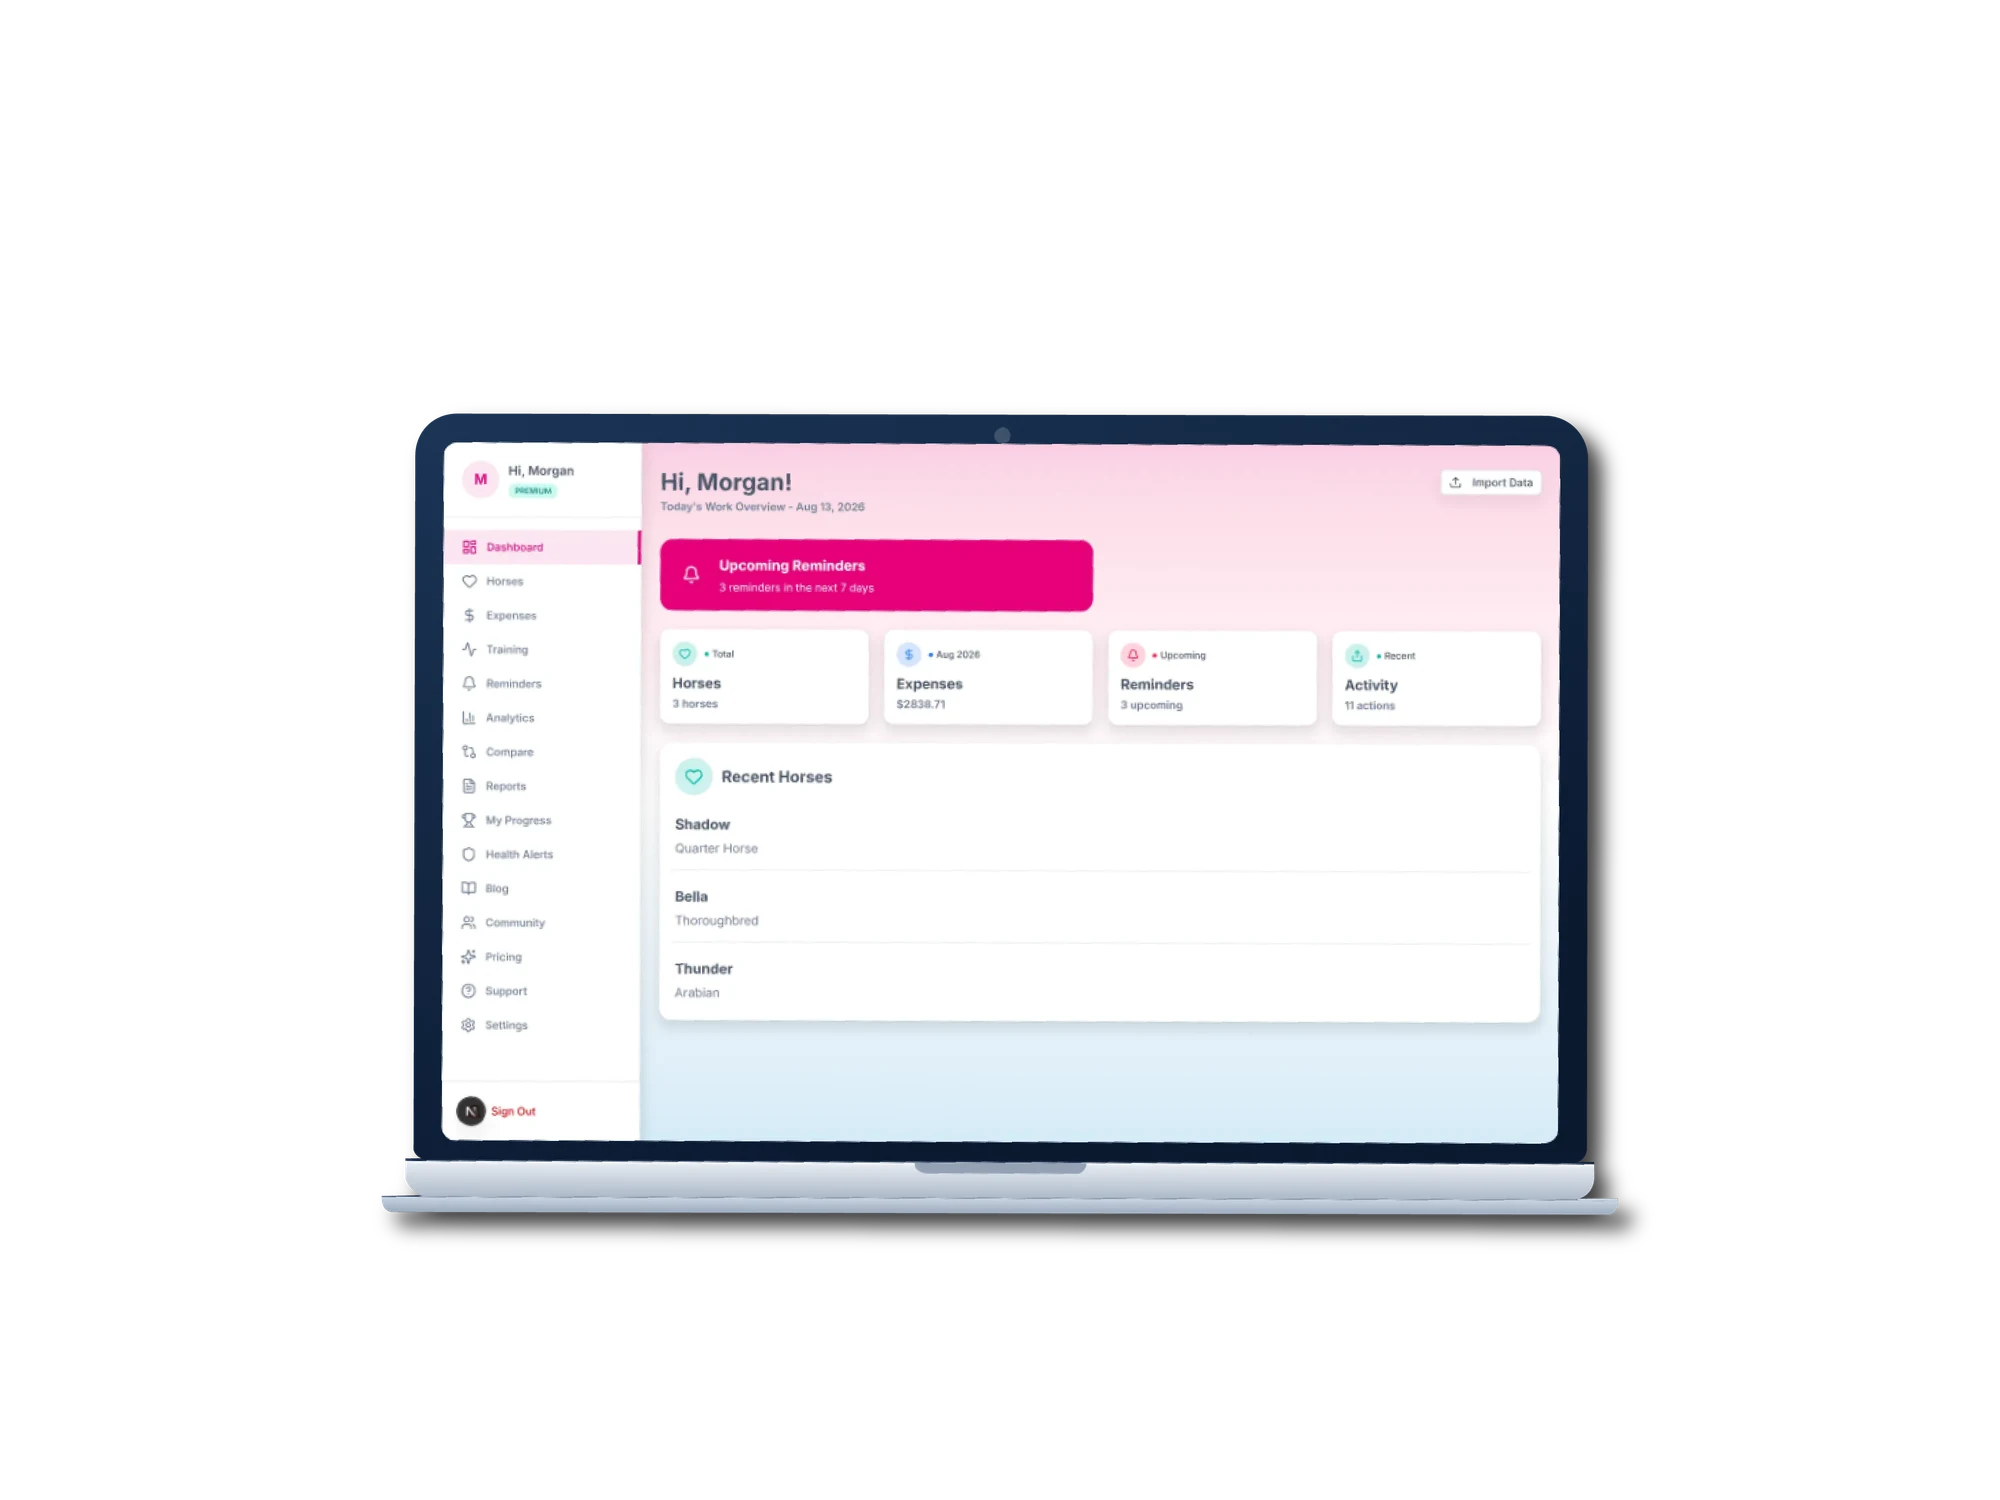
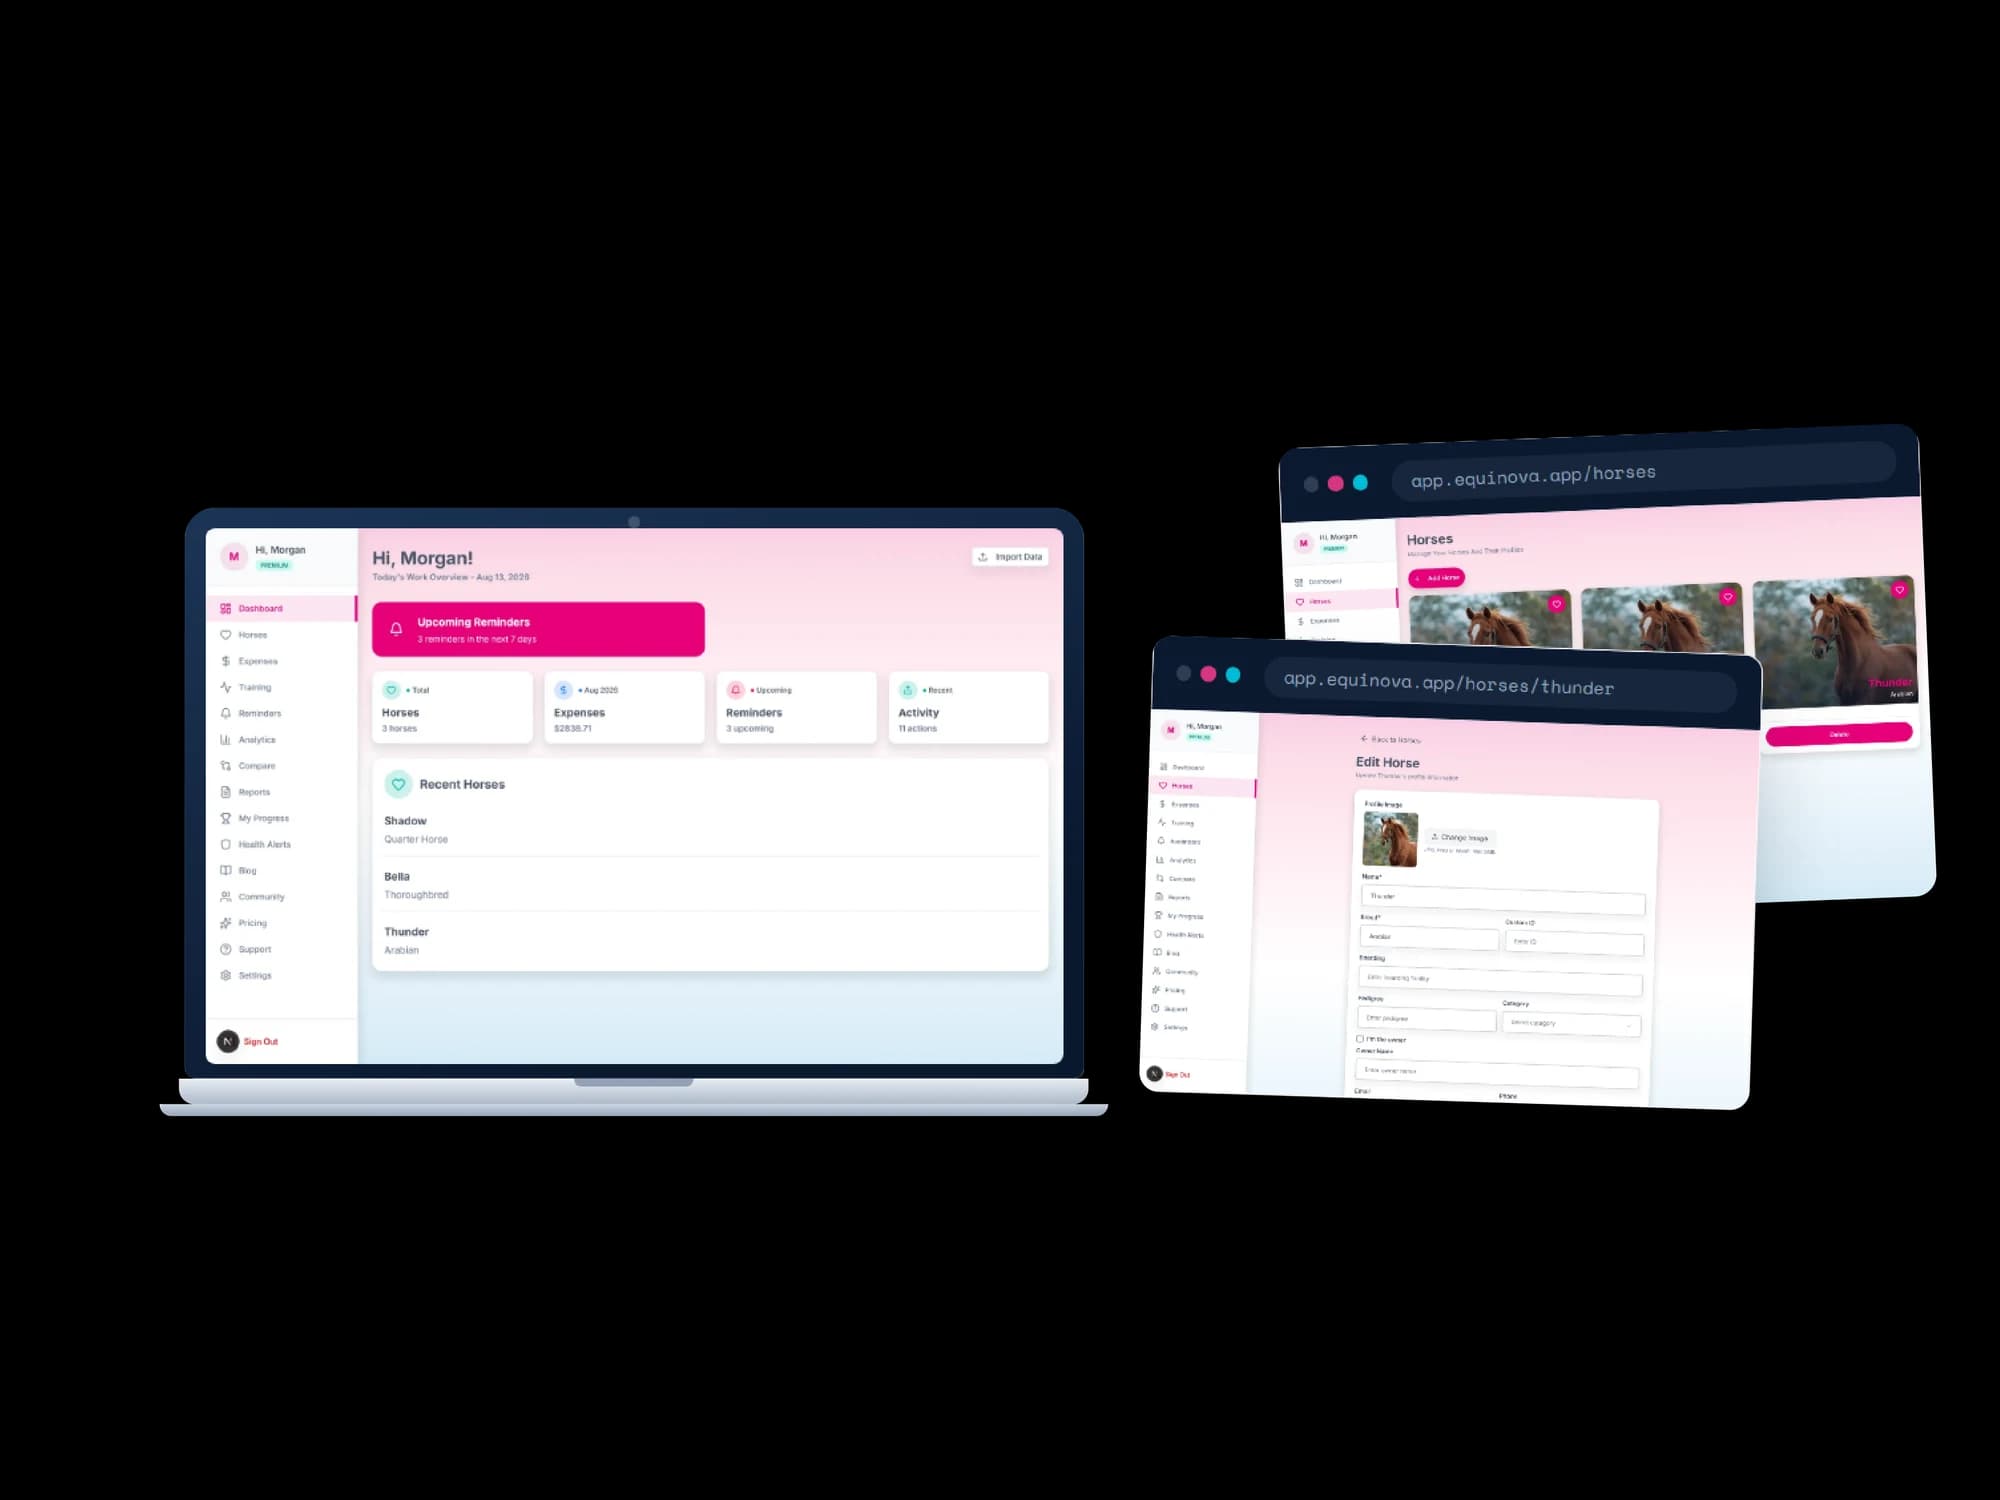
Equinova shown across a laptop and two browser windows
About the product

Every horse, every record, one platform

Equinova is a web platform built for horse owners, trainers, and stable managers who were keeping health records, training sessions, and expenses across spreadsheets, paper logs, and memory.

The build ran in two phases. Phase one is the operational core: horse profiles, health and training logs, expense tracking with CSV import and export, reminders with Google Calendar sync, and Stripe subscription billing. Phase two adds a predictive health-alert rule engine, an analytics suite with downloadable PDF reports, a progress layer of XP, achievements, challenges, and leaderboards, plus a blog and community feed.

The result is one system instead of three disconnected tools. A logged training session awards XP, feeds into a health-risk score, and shows up on next month's PDF report. For the people using it daily, that means opening one app to see whether a horse is overdue for a farrier visit, whether training load is trending toward overtraining risk, and what the month cost across the whole yard.

Industry
Equine and stable management SaaS
Platform
Responsive web app, installable as a PWA with web push
Timeline
About four months, November 2025 to March 2026
Team
Two developers

What we did

  • UI/UX design
  • Frontend development
  • Backend development
  • Database design
  • DevOps and deployment
  • Third-party integrations

Stack

Next.js 16React 19Tailwind CSS v4NestJS 11PostgreSQL with Drizzle ORMSupabaseStripeResendGoogle Calendar API
Goals

What the build had to achieve

One system of record

Replace scattered horse records with a single structured platform covering profiles, health, training, and spending, so nothing about a horse lives in a notebook the trainer cannot see.

Catch risk before it is an injury

Warn an owner while overtraining or health decline is still reversible, rather than being one more place to file the vet bill afterwards.

Make consistent logging a habit

Most tracking tools fail because people stop logging in week two. XP, streaks, achievements, and challenge leaderboards exist specifically to keep that habit alive.

Real financial visibility

Turn scattered receipts into category breakdowns, horse-to-horse comparisons, and a PDF report an owner can hand to a partner or an accountant without rebuilding it by hand.

Inside the product

Equinova, screen by screen

A laptop showing the Equinova dashboard beside two browser windows, one listing horse cards with photographs on the horses page and one showing the Edit Horse form with fields for profile image, name, breed, custom ID, boarding facility, pedigree, category, and owner contact details.
01

Horse roster and profile

Every horse gets a photo card on the roster and a structured profile behind it, so breed, boarding, pedigree, and owner contact live in one place instead of in someone's notebook.

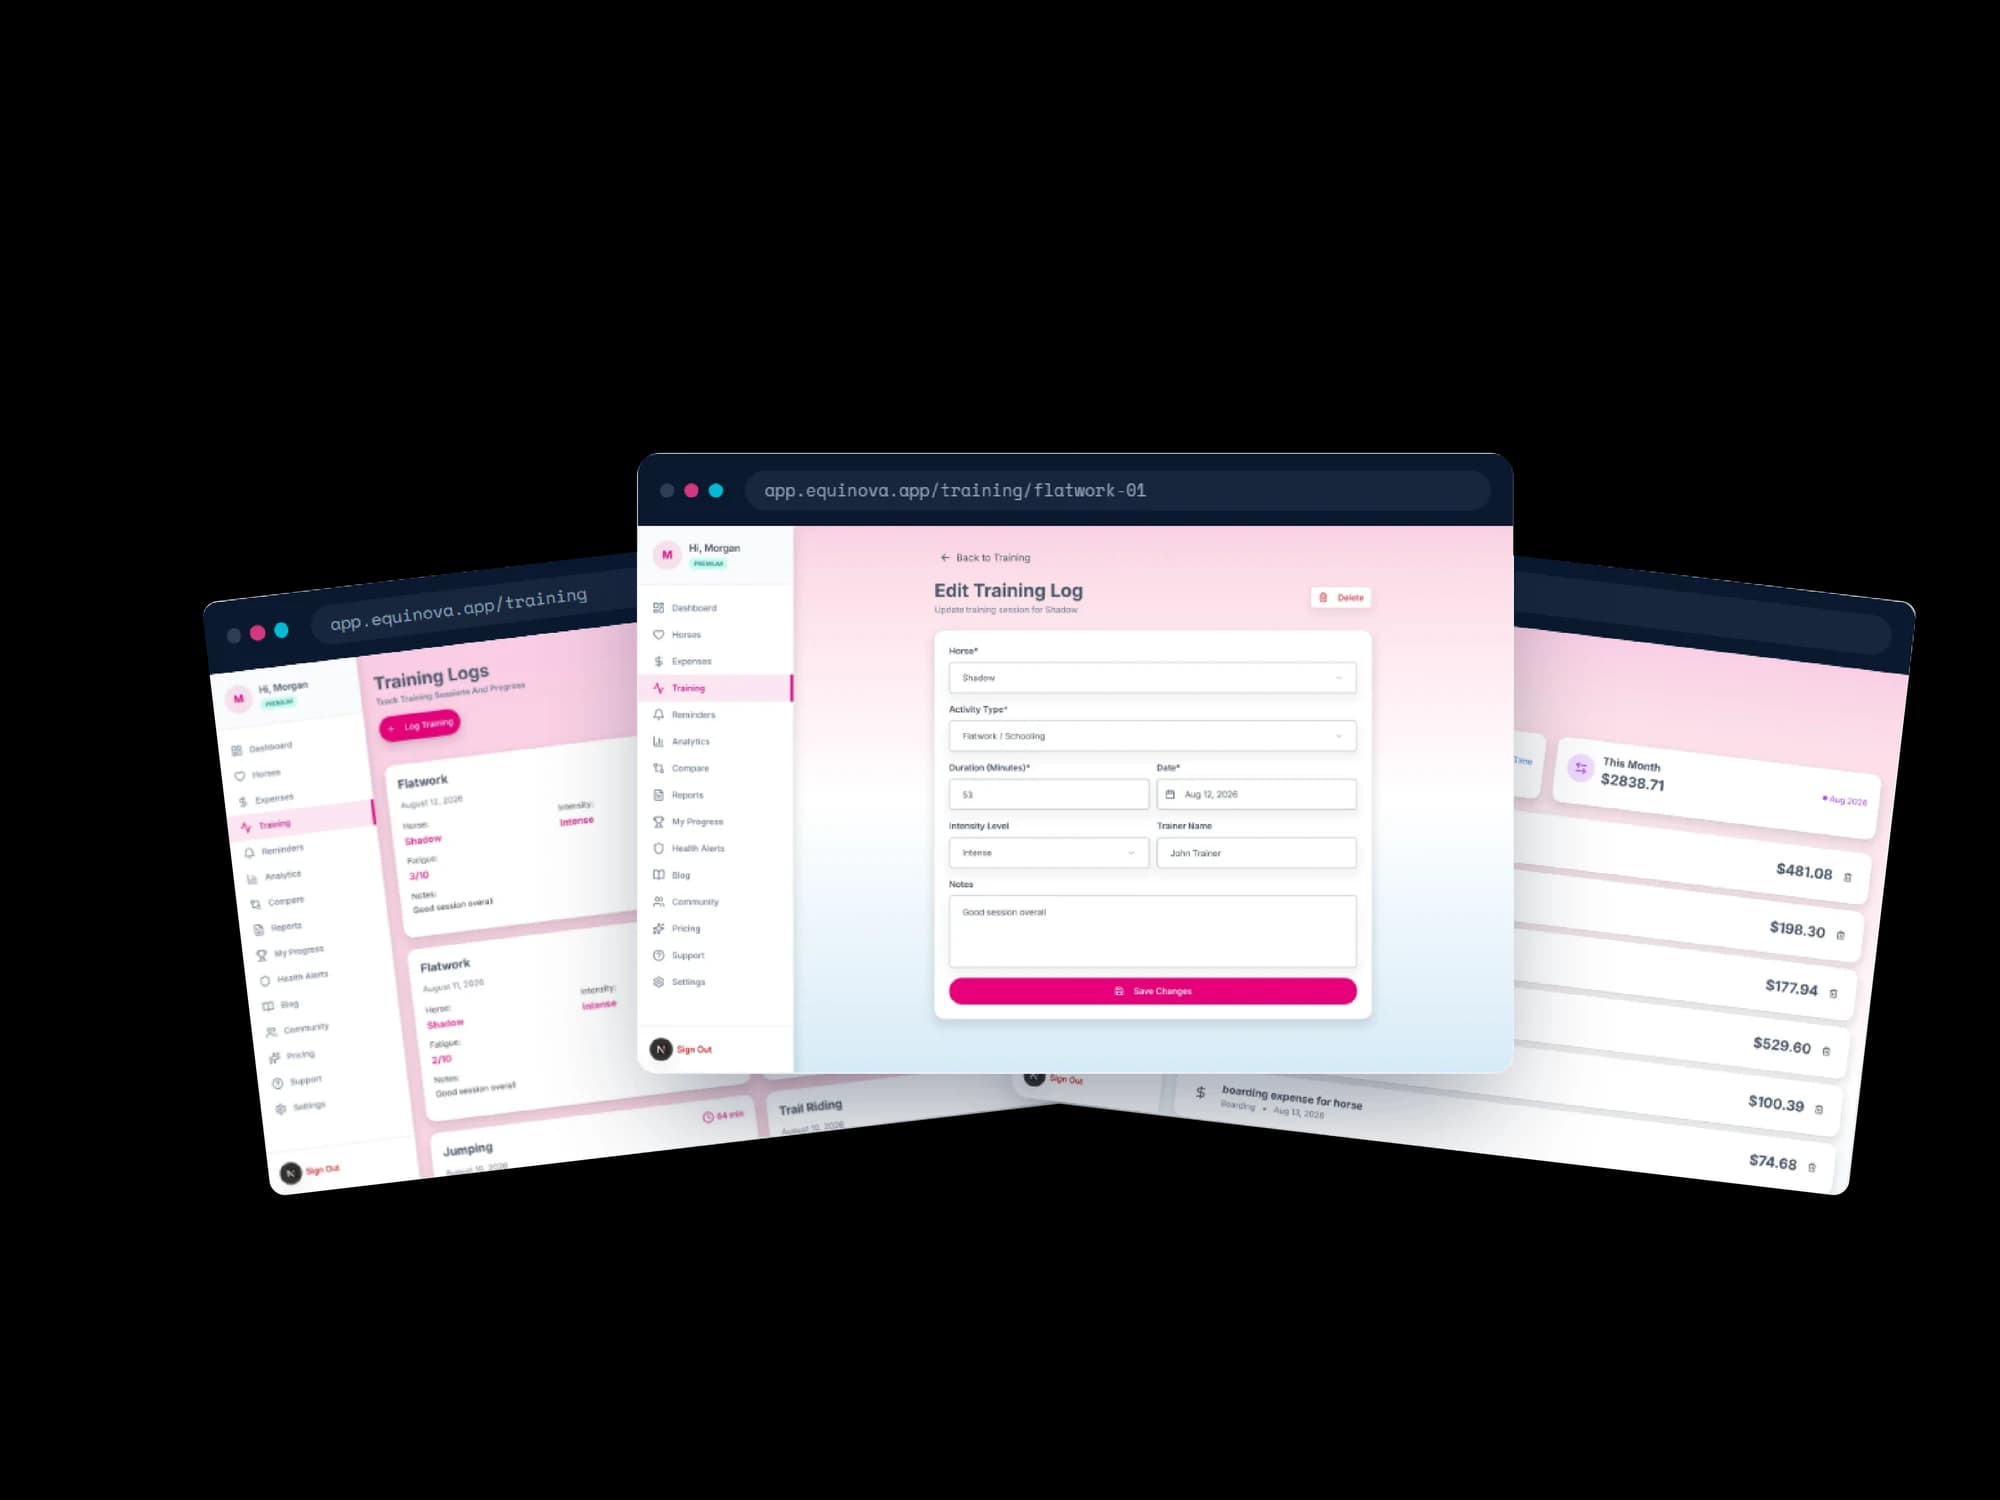
Three overlapping browser windows: a training log feed of flatwork sessions showing date, horse, intensity, and a fatigue score out of ten; an Edit Training Log form with horse, activity type, duration in minutes, date, intensity level, trainer name, and notes above a Save Changes button; and an expenses list headed by a monthly total of 2,838.71 dollars with itemised amounts beneath it.
02

Training and expense logs

Each session is filed with its horse, activity type, duration, intensity, and fatigue score, and each cost lands in the running monthly total on the expenses page.

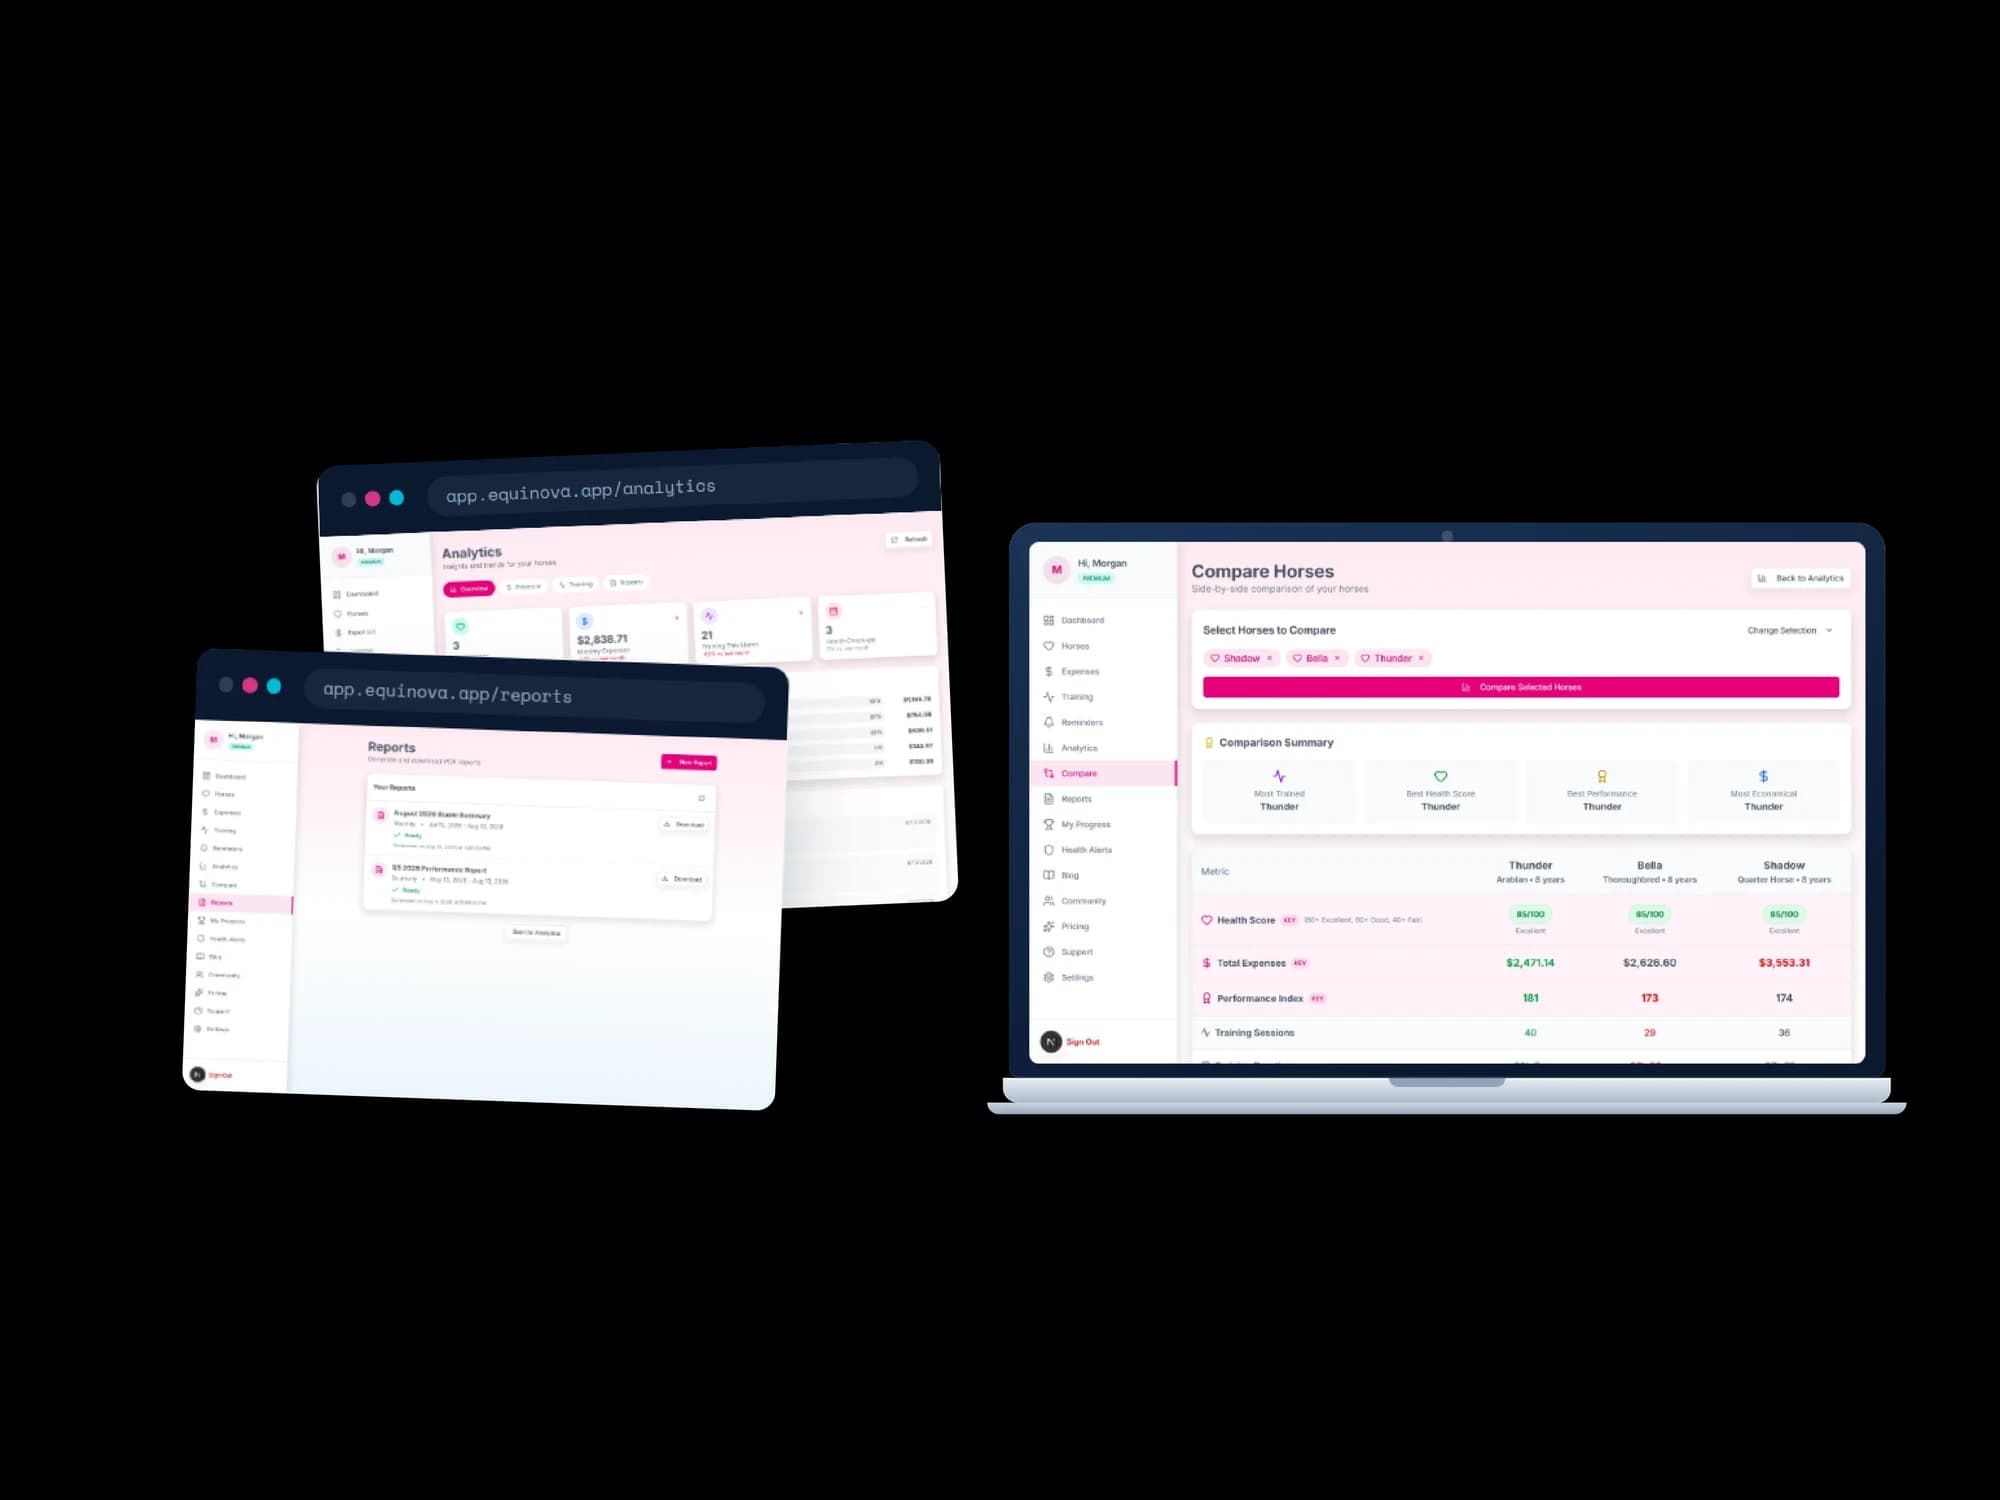
A browser window showing the analytics page with monthly expense, training session, and health checkup summary cards over a category breakdown; a second window listing two generated PDF reports marked ready with download buttons; and a laptop showing the Compare Horses view where Thunder, Bella, and Shadow are set against each other on health score, total expenses, performance index, and training sessions, with a leader named for each category.
03

Analytics, reports, comparison

The same set of calculations drives the analytics dashboard, the horse-to-horse comparison table, and the PDF reports an owner downloads, so the three never disagree.

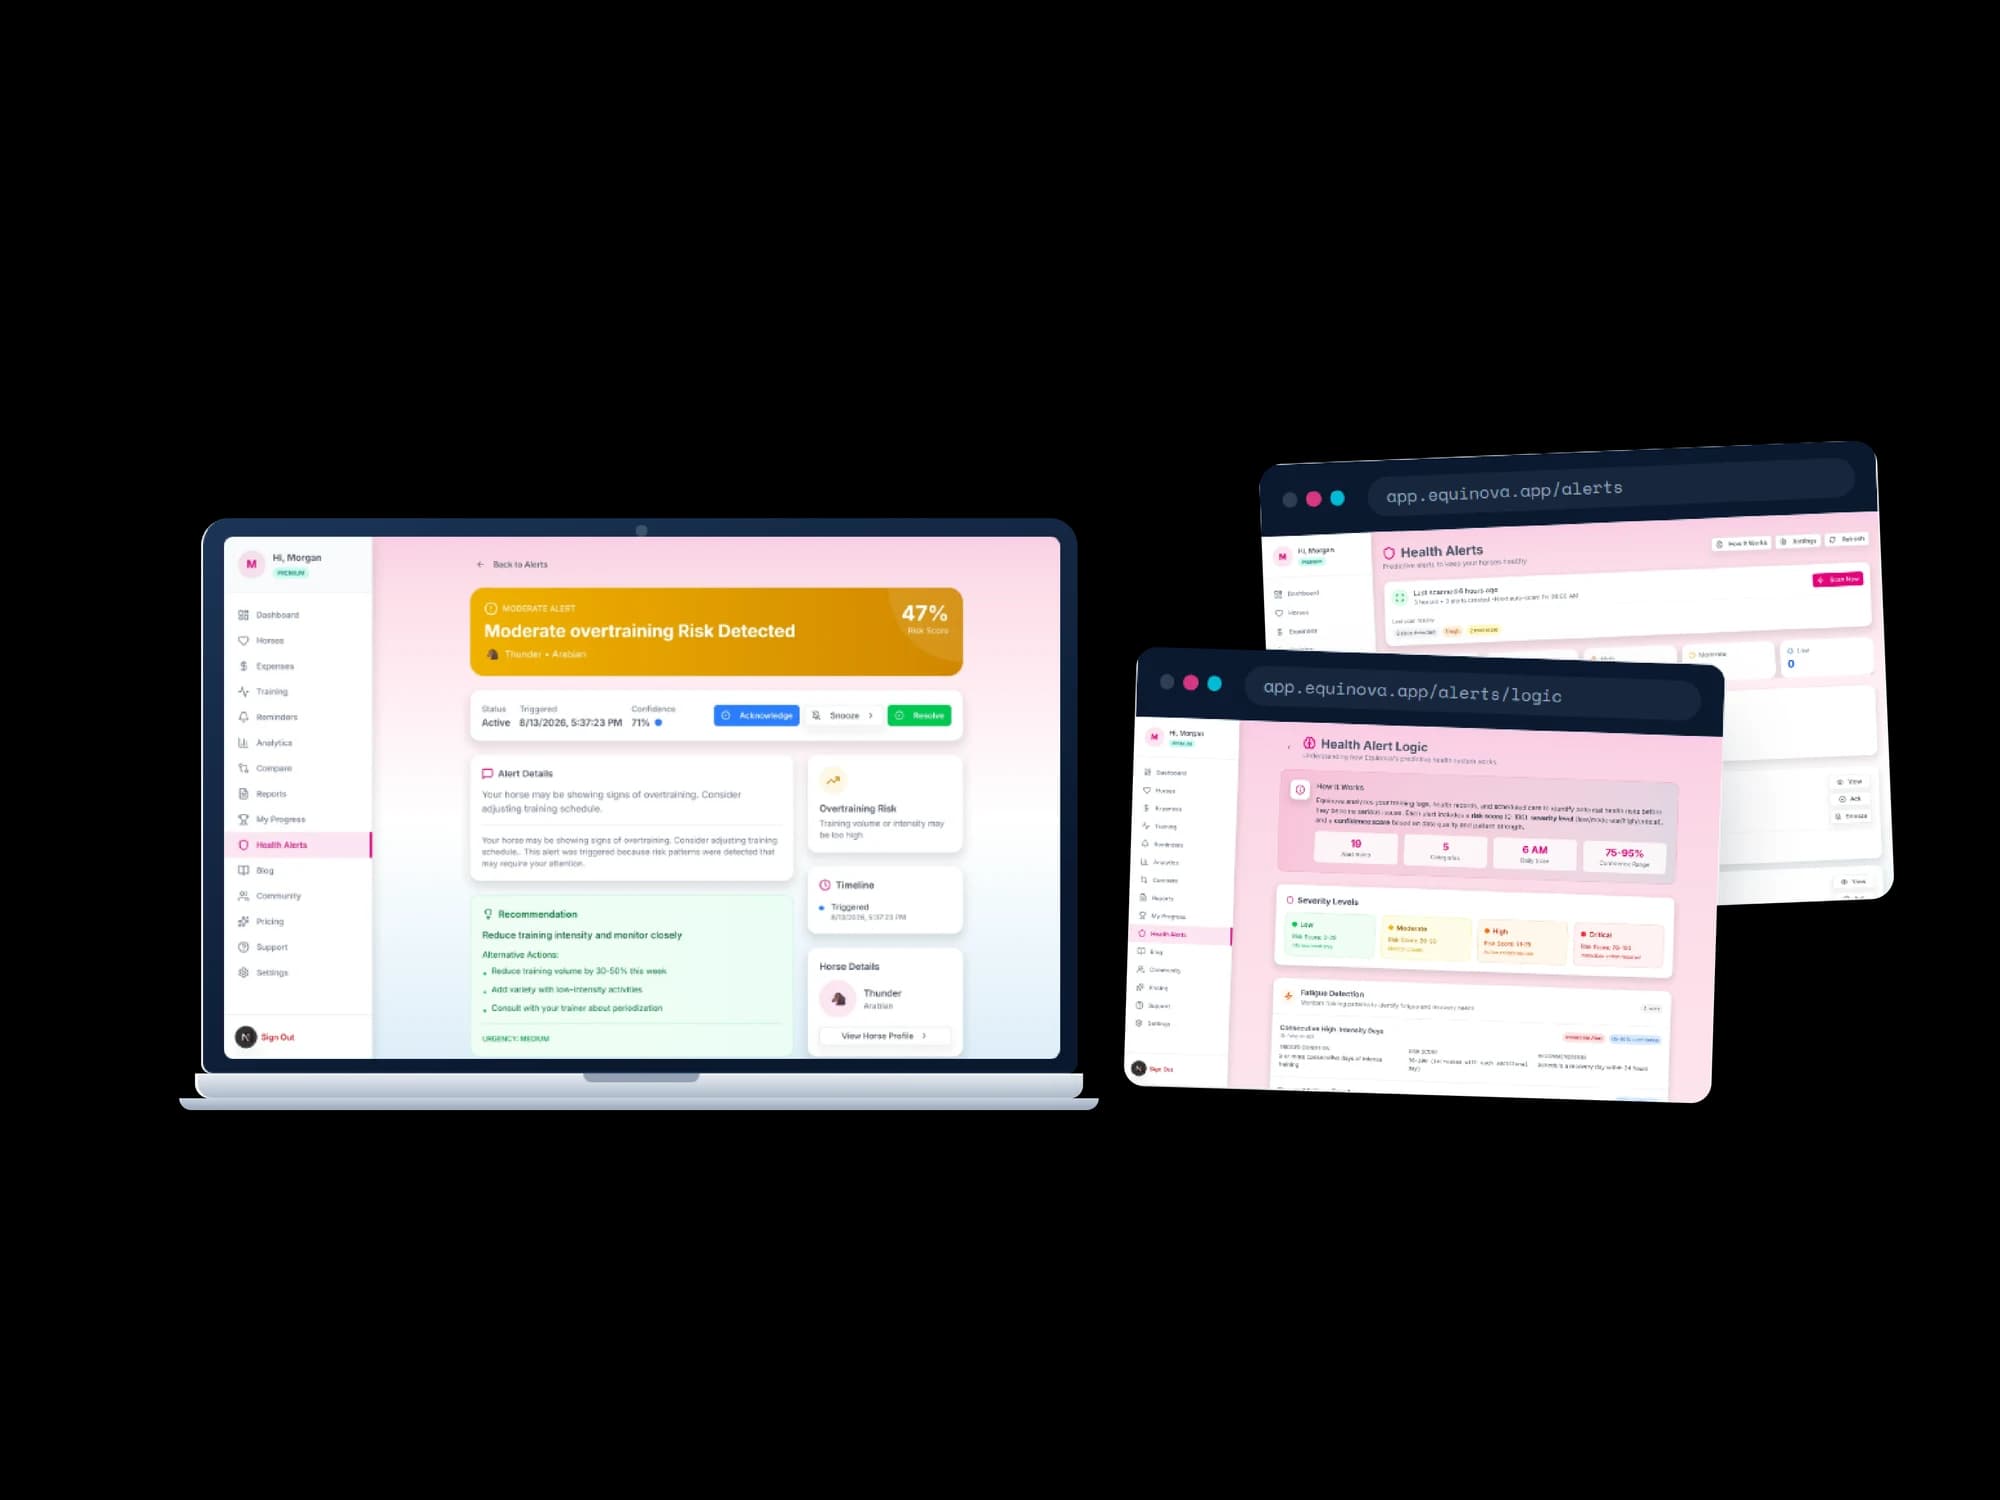
A laptop showing an alert detail page headed Moderate overtraining Risk Detected at a 47 percent risk score for Thunder, with acknowledge, snooze, and resolve actions, alert details, a green recommendation panel listing alternative actions, and a trigger timeline. Two browser windows behind it show the health alerts list and a Health Alert Logic page stating 19 rules across 5 categories, a 6 AM daily scan, a 75 to 95 percent confidence range, and four severity levels.
04

Predictive health alerts

A flagged risk arrives as advice rather than a red dot: a risk score, a confidence level, a recommendation with alternative actions, and a public page documenting every rule behind it.

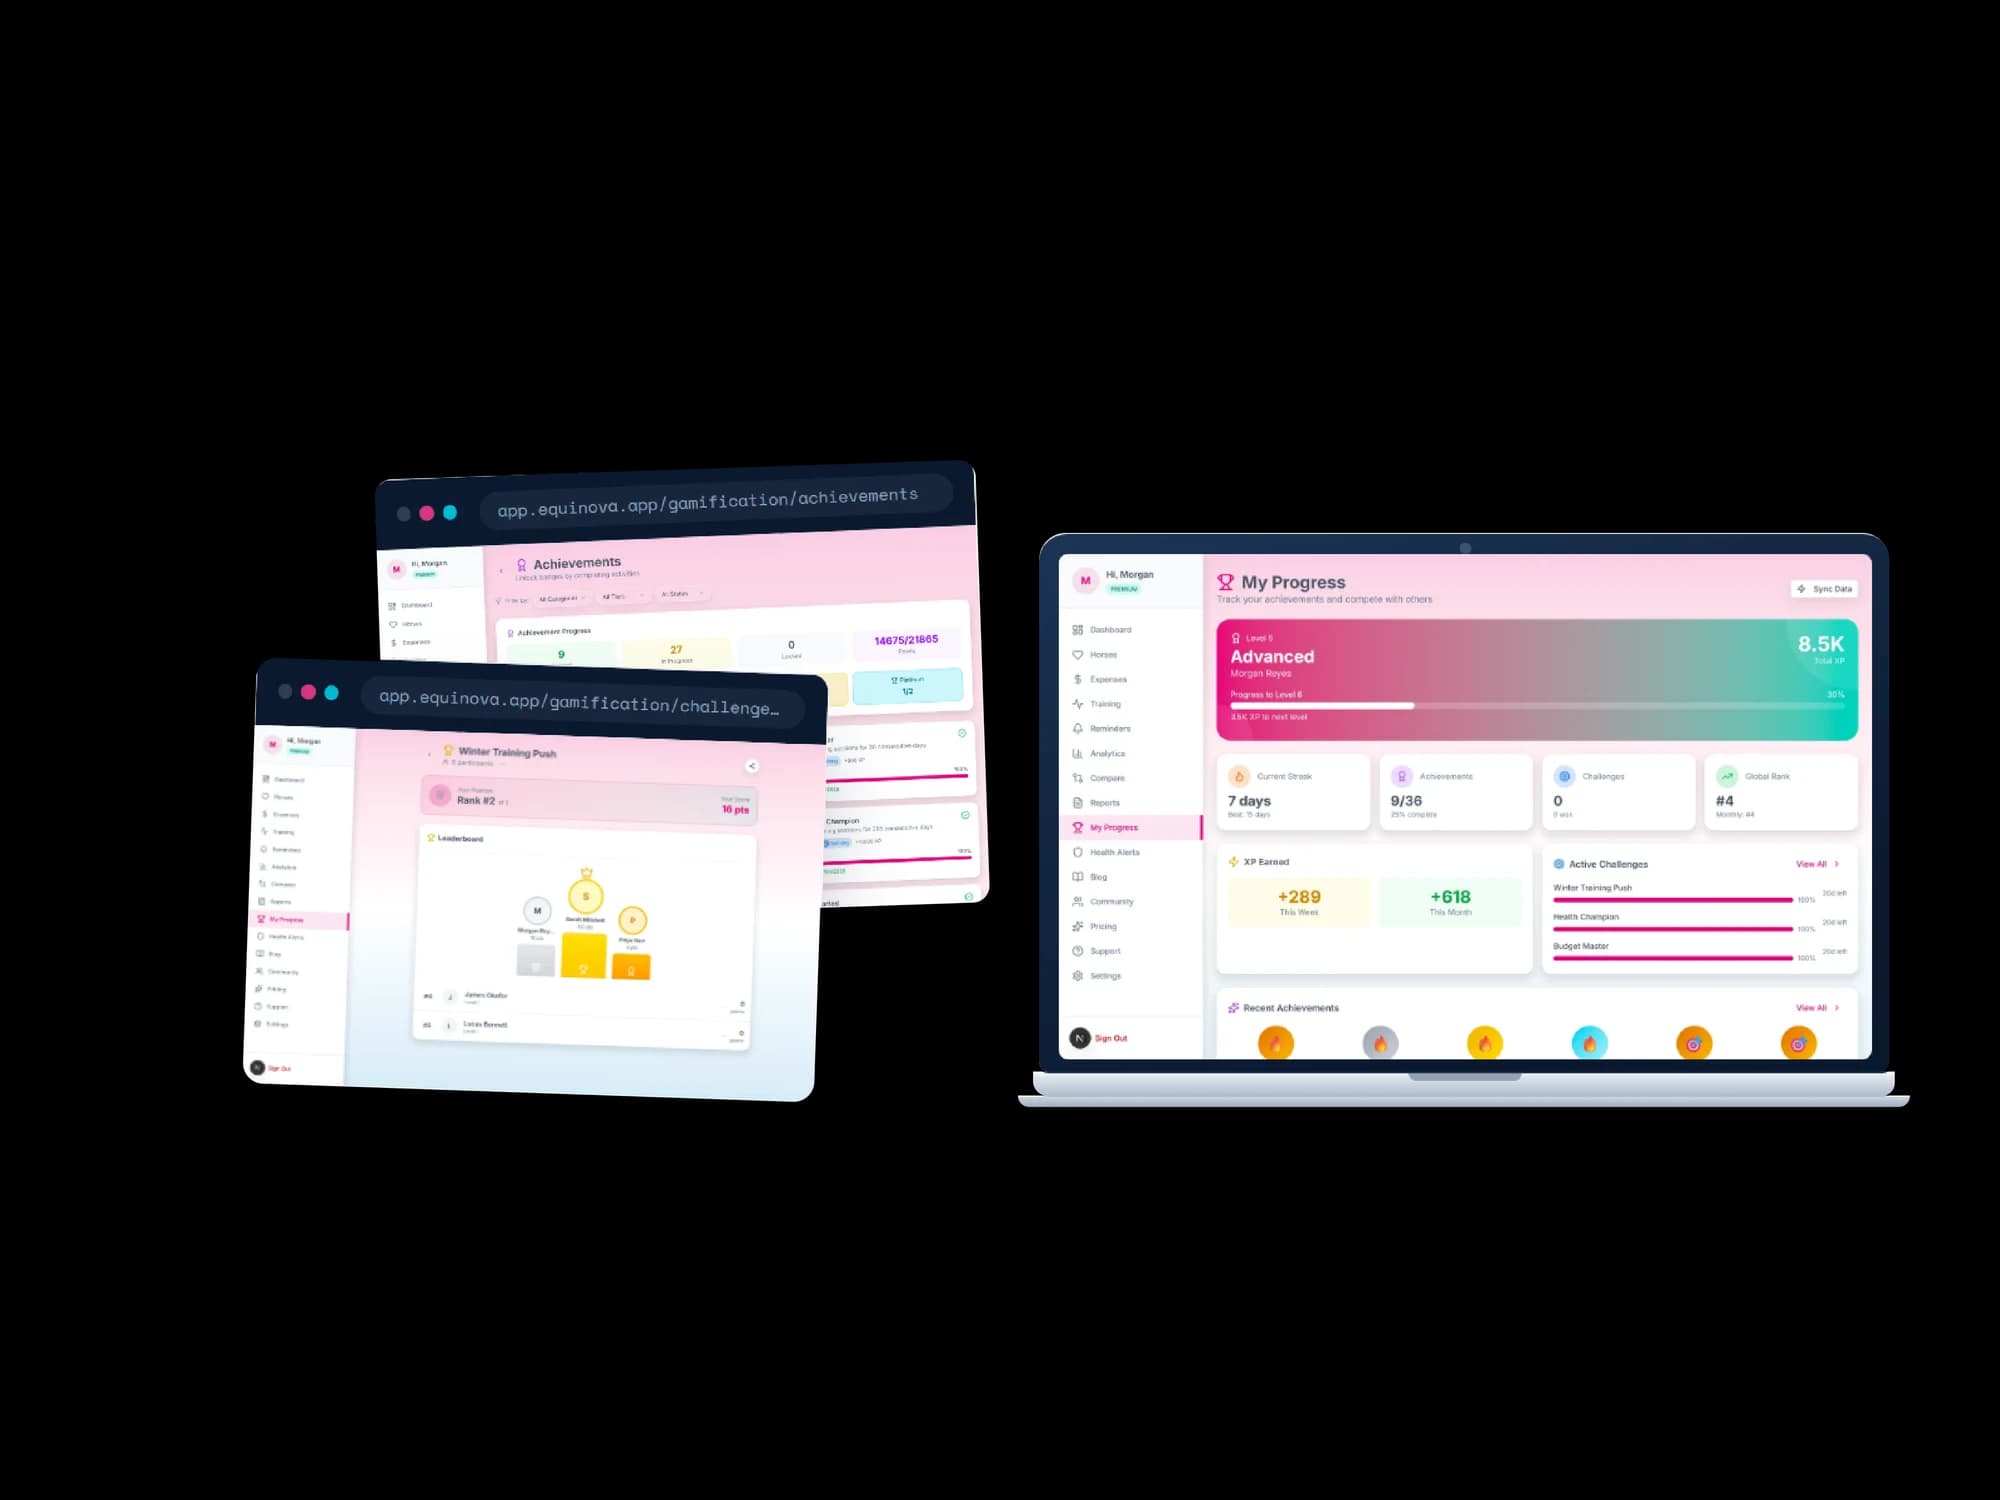
A laptop showing the My Progress page with a Level 5 Advanced banner, total XP, a progress bar to the next level, a seven day streak, nine of thirty-six achievements, a global rank, weekly and monthly XP earned, and three active challenges at full progress. Two browser windows behind it show the achievements catalogue with earned, in progress, and locked counts, and a challenge page with a podium leaderboard and ranked participants.
05

Progress, badges, leaderboards

Levels, streaks, achievements, and ranked challenges give people a reason to keep logging past week two, which is where most tracking tools quietly die.

Challenges

The parts that were genuinely hard

01

Alerts an owner will actually act on

The problem

A warning that says only "risk detected" gets dismissed. For a health alert to change what someone does that week, it has to explain what triggered it, how sure it is, and what to do instead.

What we did

We built a rule engine of 19 named rules across five categories: fatigue, overtraining, injury risk, health decline, and schedule compliance. It scans every morning and produces a risk score, a confidence level, and a specific recommendation with alternative actions. A public logic page documents every rule and its trigger condition.

The outcome

Alerts read as advice rather than noise, and an owner can check the reasoning behind any flag without asking support.
02

One calculation behind three surfaces

The problem

The analytics view, the horse-to-horse comparison, and the downloadable PDF all report on the same money and the same training volume, drawn from health logs, training logs, and expenses. If they are built separately, they drift, and the first mismatch costs the product its credibility.

What we did

We put every metric in one analytics service and made the comparison view and the PDF generator two renderers over the same calculations, including the logic that picks a leader per metric across an arbitrary set of horses.

The outcome

The dashboard, the comparison table, and the exported report always agree, and a new metric ships to all three at once.

03

Data isolation enforced at the database

The problem

Every owner's records are private, and the platform reads from Postgres through more than one path. Checking permissions only in the API layer would leave that guarantee resting on a single tier.

What we did

We enabled row level security across ten tables and wrote ownership-scoped policies on each, including a subquery policy for health logs that resolves ownership through the horse rather than a direct foreign key.

The outcome

Isolation holds at the database itself, so the API layer and the data layer both have to agree before a row is returned.

04

Getting years of spreadsheets in, and out again

The problem

Every prospective user already had a system: a spreadsheet with years of expenses in it. Asking them to retype it is where adoption dies, and refusing to give it back is why people distrust a new tool.

What we did

We built CSV import for bulk expense history and CSV export for everything the platform holds, with the same category structure on both sides, so the accountant's workflow survives the move.

The outcome

New users can start from their existing records on day one, and nobody has to feel locked in to keep using the product.

Approach

How the work ran

  1. 01

    Discovery and research

    The build started from a written technical plan rather than a blank editor: a tech-stack comparison, a 14-week feature plan splitting phase one and phase two across the two developers, and a complete PostgreSQL schema design, all agreed before the first backend commit.

  2. 02

    UI/UX design

    Every core screen was designed in Figma before implementation, 42 mockups covering the product surface ahead of the Next.js build, so layout decisions were settled in design rather than in code review.

  3. 03

    Development and testing

    Work split cleanly by ownership. One developer took auth, horses, and infrastructure, the other took expenses, training, reminders, and the dashboard, then both moved into phase two together. Backend modules carry Jest unit tests, with end-to-end specs covering auth, horses, and the full phase two surface.

  4. 04

    Deployment and support

    The frontend runs on Vercel with Analytics and Speed Insights wired in, and the backend on Railway from a multi-stage Docker build. Google Tag Manager, GA4, and Meta Pixel sit in the signup flow so acquisition can be measured after launch.

Features

What shipped

Horse profile management

A structured profile per horse covering breed, gender, colour, weight, height, microchip ID, boarding facility, trainer, and owner contact, so nothing depends on what one person remembers.

Health and training logging

Vaccination, checkup, farrier, and treatment records with vitals including temperature, heart rate, and respiratory rate, alongside training sessions logged with intensity, fatigue, and energy level.

Expense tracking with CSV import and export

Categorized costs across feed, medical, training, equipment, transport, boarding, and farrier, with bulk CSV import for existing spreadsheet users and export for the accountant.

Predictive health alerts

A 19-rule engine across five categories that scans daily and returns a risk score, a confidence level, and a specific recommendation on every alert it raises.

Progress, achievements, and challenges

36 achievements across four tiers, a streak-tracked XP and levelling system, and time-boxed challenges with a ranked leaderboard for each one.

Stripe subscription billing

Live Stripe Checkout sessions and webhook handling across free, premium, pro, and lifetime tiers, wired into plan entitlements rather than sitting on top of them.

Results

Measured, not estimated

100 / 100

Lighthouse SEO

A perfect SEO score on the audited dashboard build, with metadata, crawlability, and document structure all clean.

92 / 100

Lighthouse best practices

Measured on the same audit run, covering browser API usage, console health, and secure asset delivery.

90 / 100

Lighthouse accessibility

Contrast, labelling, and semantic structure audited across the dashboard rather than added as a late pass.

Build a platform like this with us

Equinova went from a written plan to a deployed, tested product in about four months. Tell us what you are building and we will show you how we would ship it.

Have a Project To Discuss?

Contact Us